All Case Studies

ProductX Leads

The Internal Tool That Runs A Two Person Agency

I designed and built this for a 2 person Ontario web design agency to run their entire outbound process from one screen. I am the designer and the AI builder, which means I made the calls and Claude Code wrote most of the code under my direction. About 1,600 leads pass through it right now.

Role
Founding Designer and AI Builder
Year
2026-Present
Services
Product Design, UX, UI, AI Builder
Industry
Internal Tooling, Sales, MarTech
Duration
Ongoing
Deliverables
Web Dashboard, Lead Pipeline, AI Workflows
Scroll Down
ProductX Leads brand visual

Challenge

I run a small Ontario web design agency with two part-time people on the phones. The standard playbook for sales pipelines is to stitch together five different tools, like a contact database, a dialer, and a calendar app, and pay per seat for each. That works for a 30 person sales team. At our scale, the bill is steep and the context switching between five tabs eats most of the dialing day. So we did not have a sales tool that fit. The existing options were either too expensive, too generic, or built for a kind of business we do not run.
Approach

I designed and built it myself, which is something I could not have done two years ago. I am a designer, not a software engineer, but I have gotten very good at directing Claude Code to write the code I describe. That means the whole tool, the dashboard, the dialer, the scraper, the AI flows, all of it, exists because I sat down and described what I wanted on each screen. The product reflects how I think about a small sales team, not how a venture-backed SaaS company would build the same thing.

Outcome

One internal tool that the two of us actually use every day. It pulls leads from Google Maps, audits their websites with AI to surface what is wrong with them, calls those signals up next to a phone number, lets us dial through a list, and books discovery calls that land in the lead's calendar with a real meeting invite. It is not a SaaS product. It is not for sale. It is just for us.

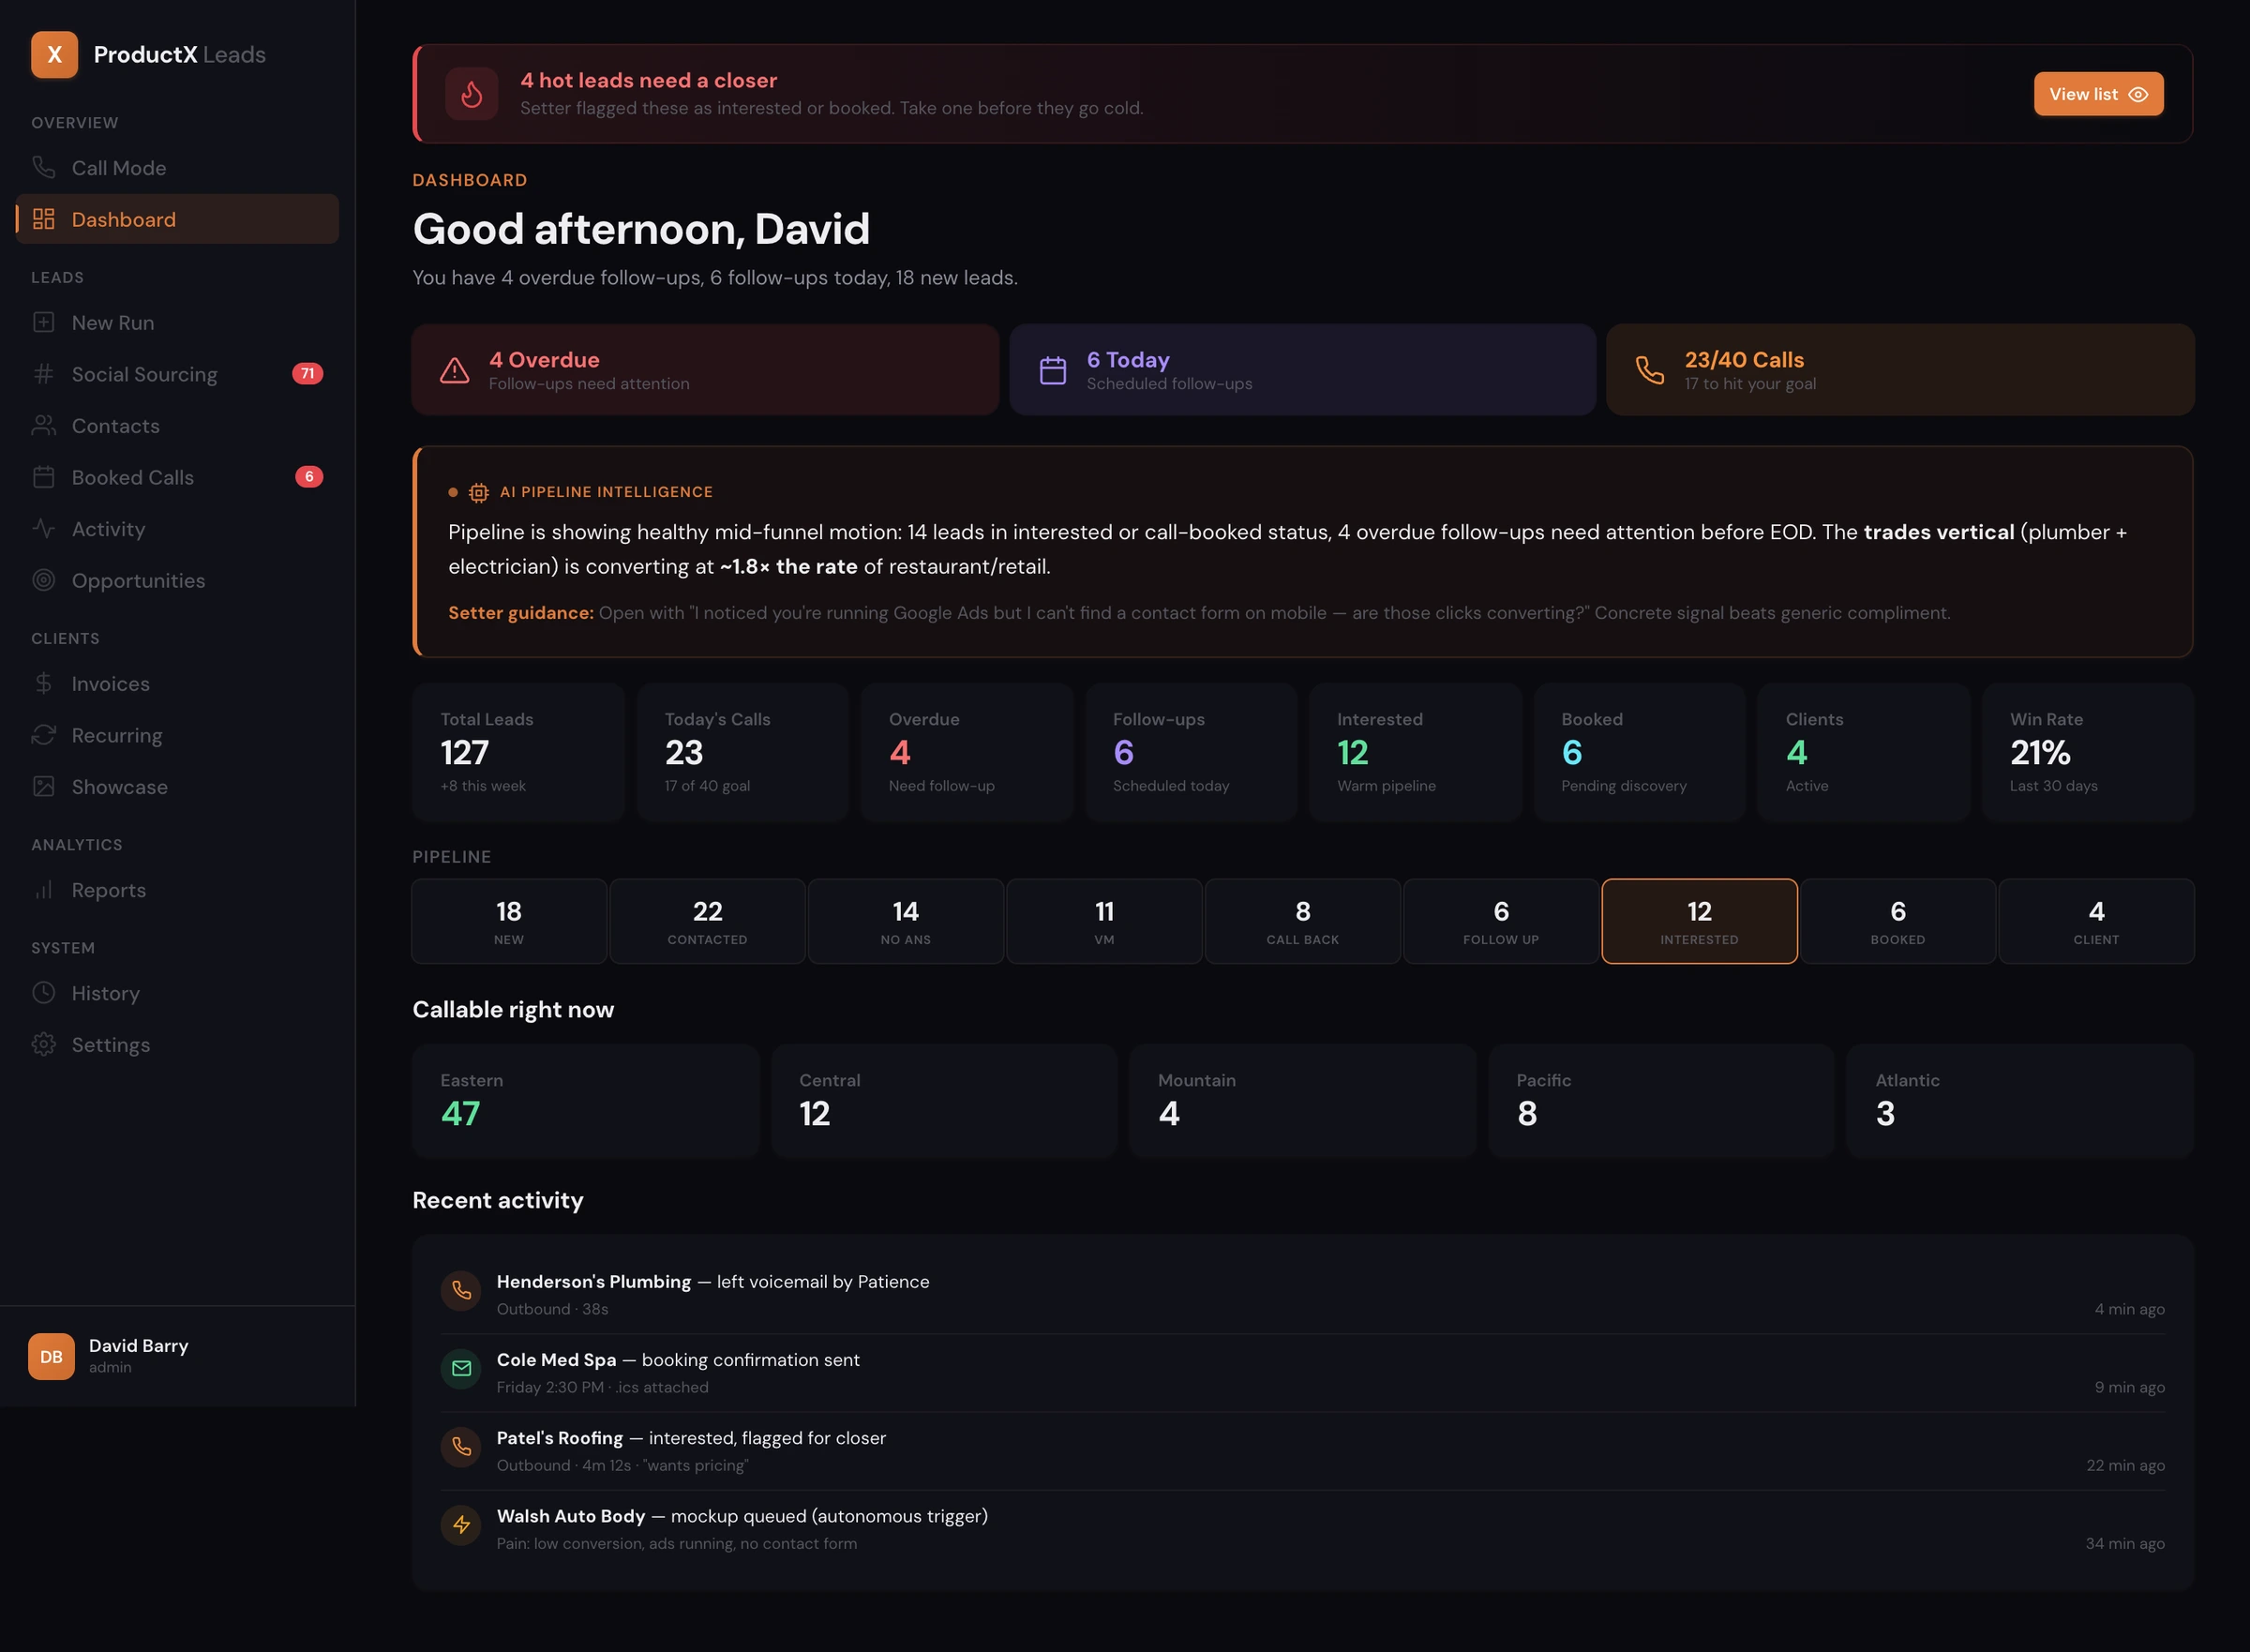
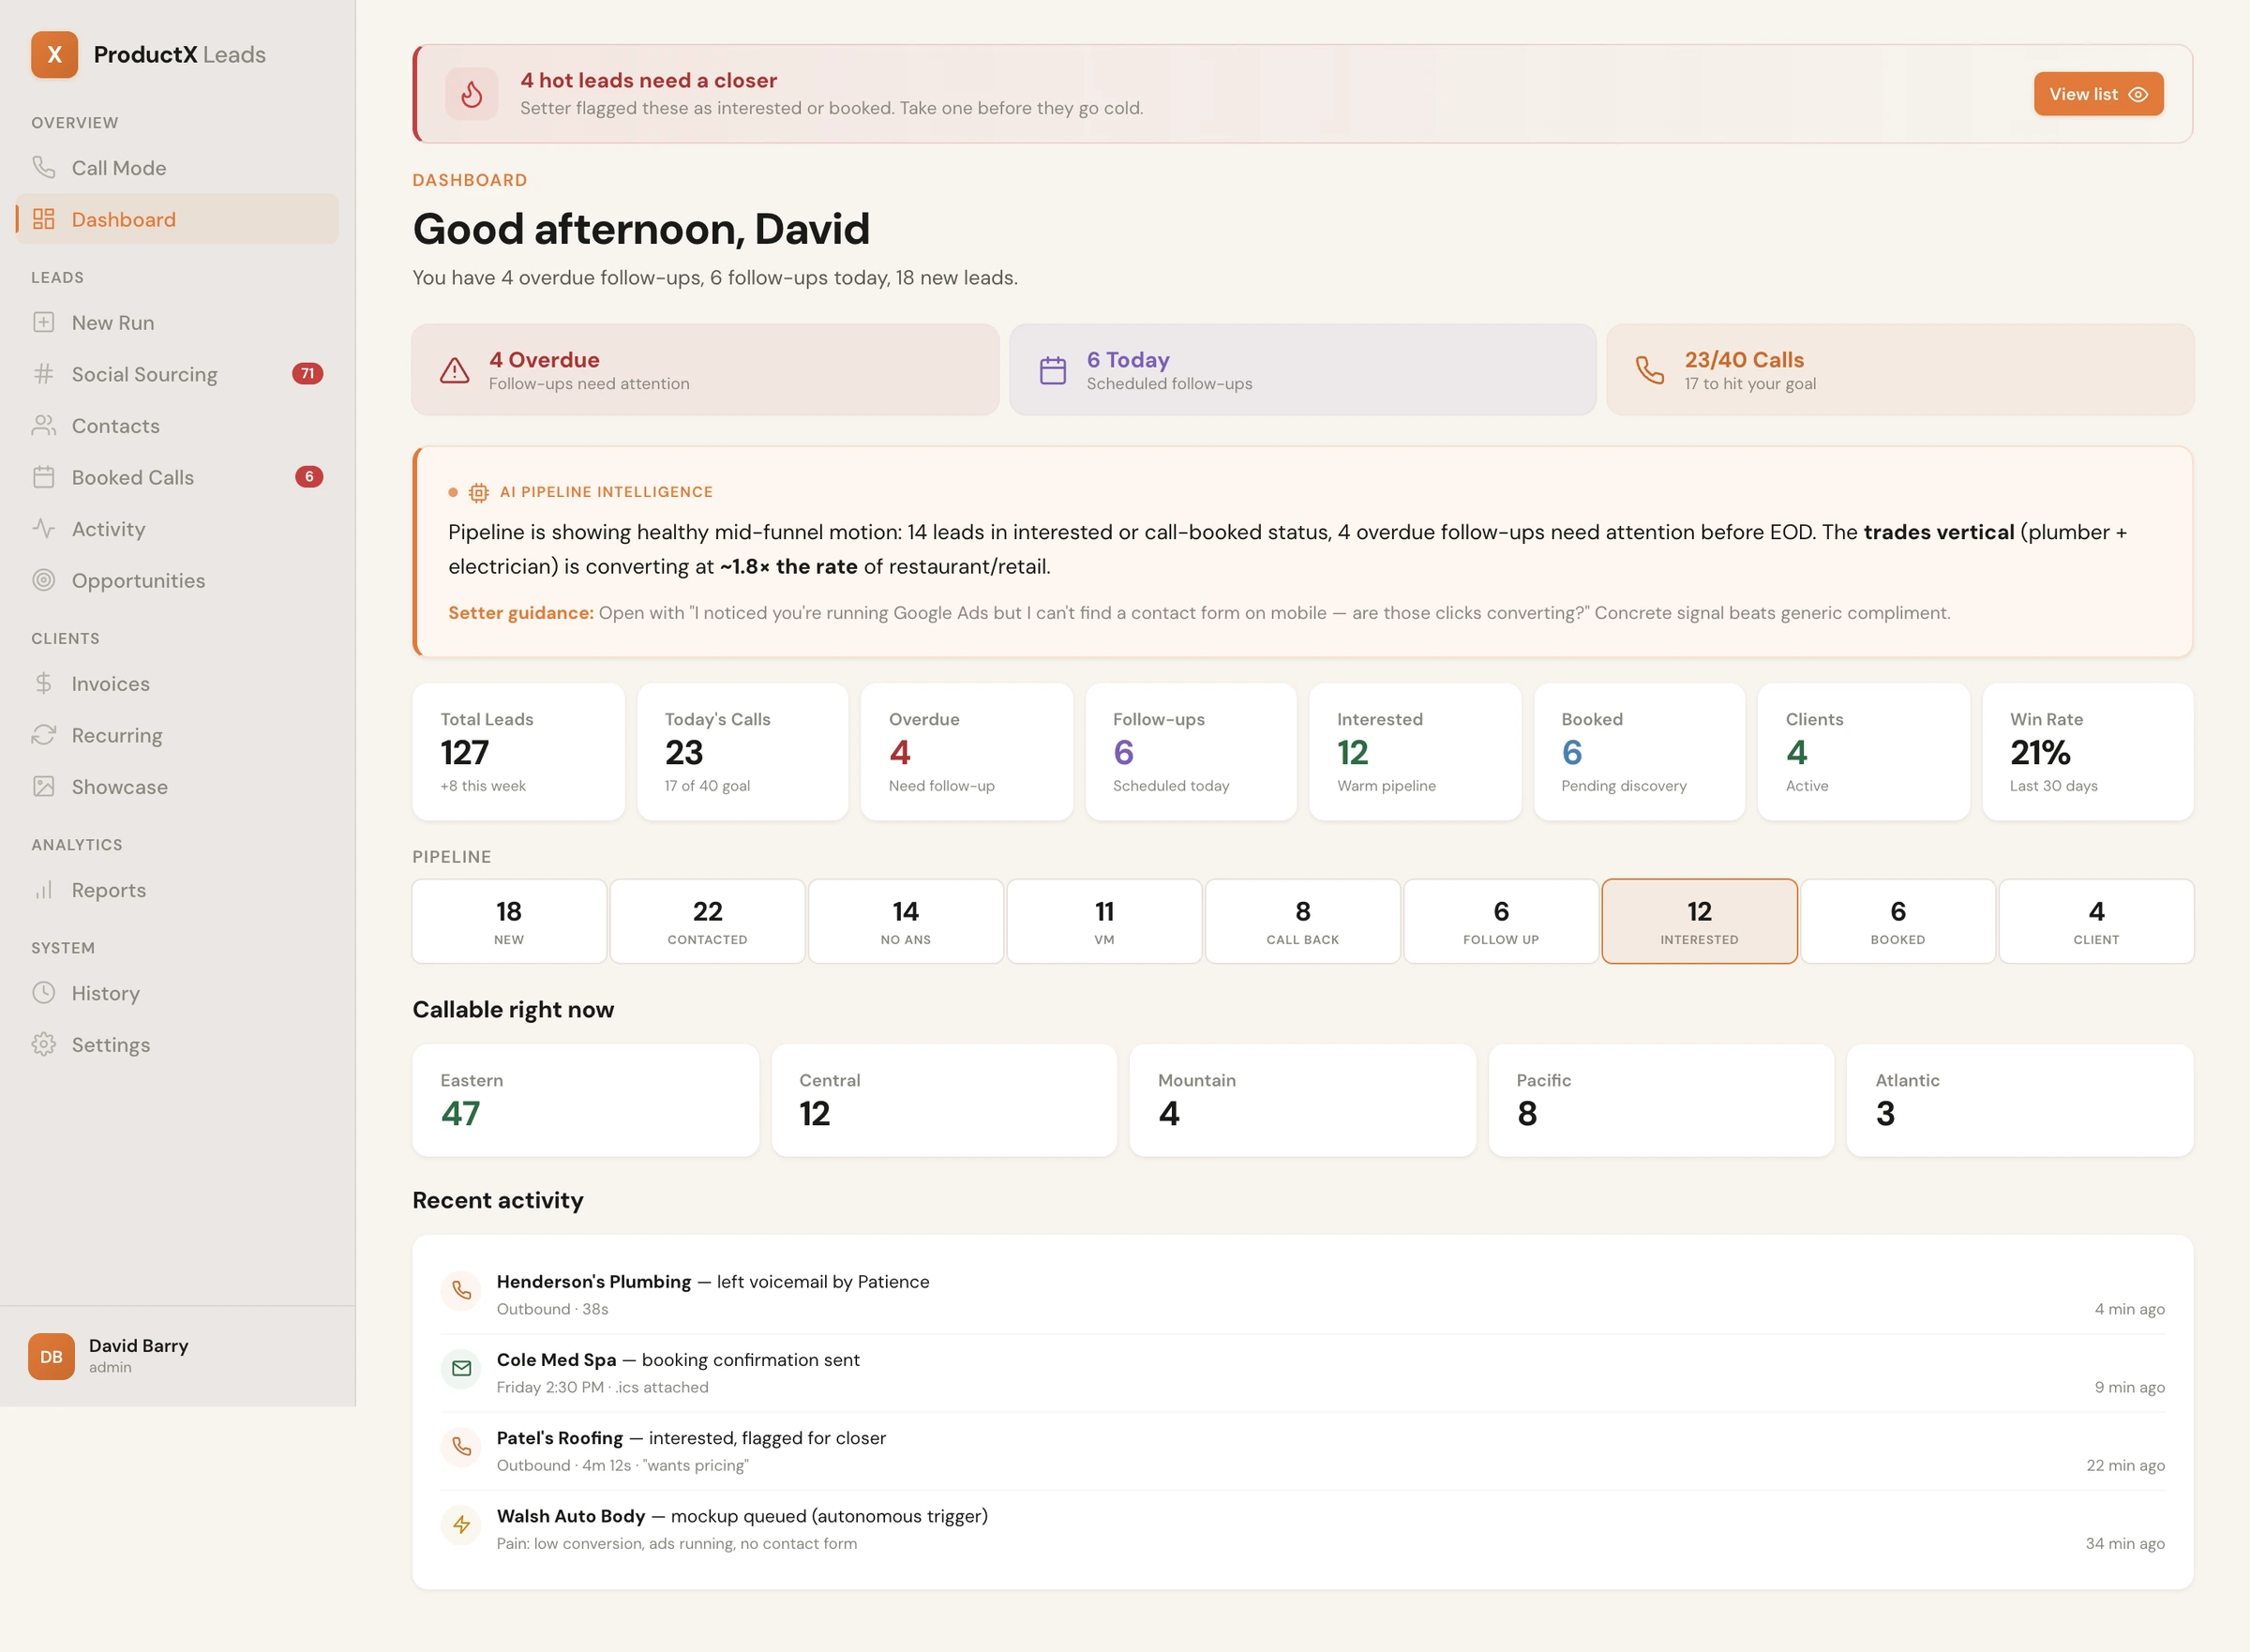
The first thing I see is where the pipeline is leaking.

I designed this screen as a single morning glance. The hot-leads banner at the top is for the days when someone has flagged a lead as ready for a closer and I have not gotten to it yet. The three tiles underneath tell me what is overdue, what is happening today, and how close we are to the weekly call goal. The pipeline funnel below them shows where the drop-off is happening this week, which tells me whether the problem is at the top of the funnel or at the booking step. The callable-now row at the bottom shows how many leads I could be on the phone with right now, broken down by timezone. I built the Claude-written pipeline intelligence paragraph because I noticed I was missing patterns my eye should have caught.

ProductX Leads dashboard
The morning glance

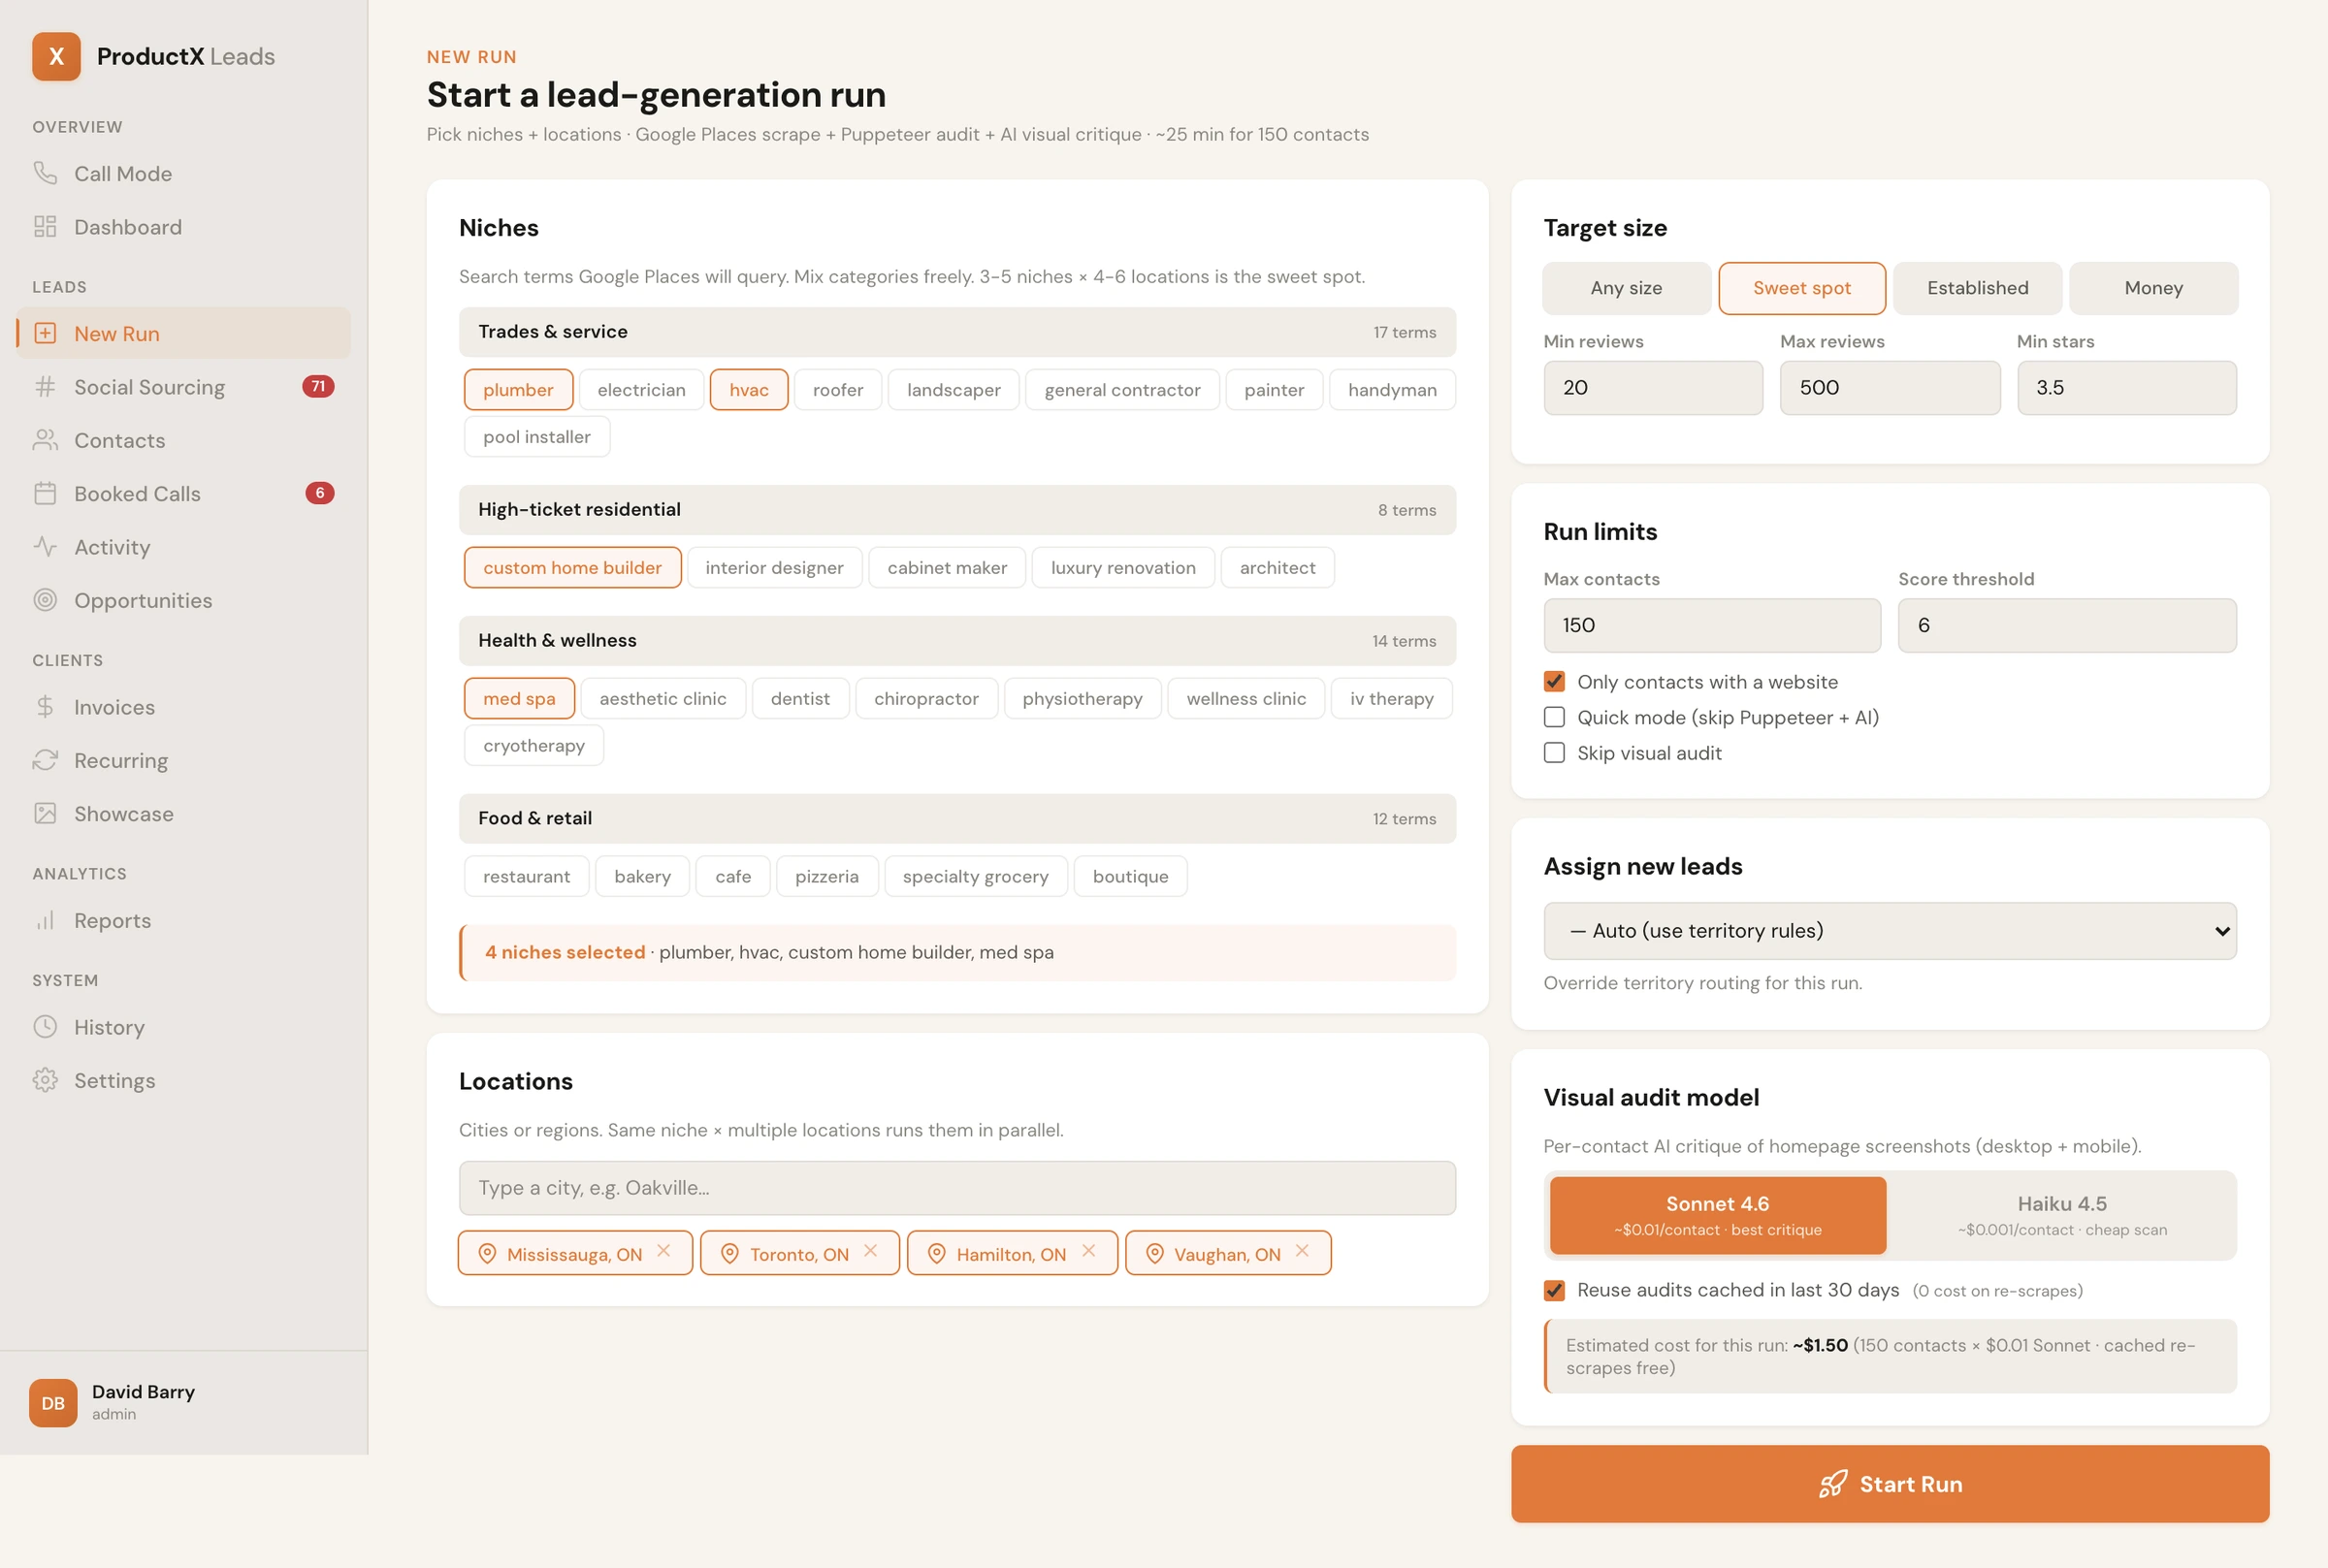
I made the cost visible before you press the button.

This is the screen where I tell the system to go find a new batch of leads. The picker is grouped by category because that is how I think about which kinds of businesses we want to talk to this week. I pick a few niches like plumbers or custom home builders, drop in a few cities, and the system scrapes Google Maps and audits each business's website to score them.

The thing I am most proud of on this screen is the cost estimate next to the Start Run button. Most AI tools hide what a thing actually costs until the invoice arrives. I built this for myself, so I wanted to know before I clicked. If I pick the better AI model the run is around a dollar and a half. If I pick the cheap model it is around fifteen cents. I get to choose, and the toggle is honest about the trade. It also caches audits for 30 days, so if I rescrape a city I already looked at, those audits are free.

ProductX New Run wizard
New run, with the cost shown before you click

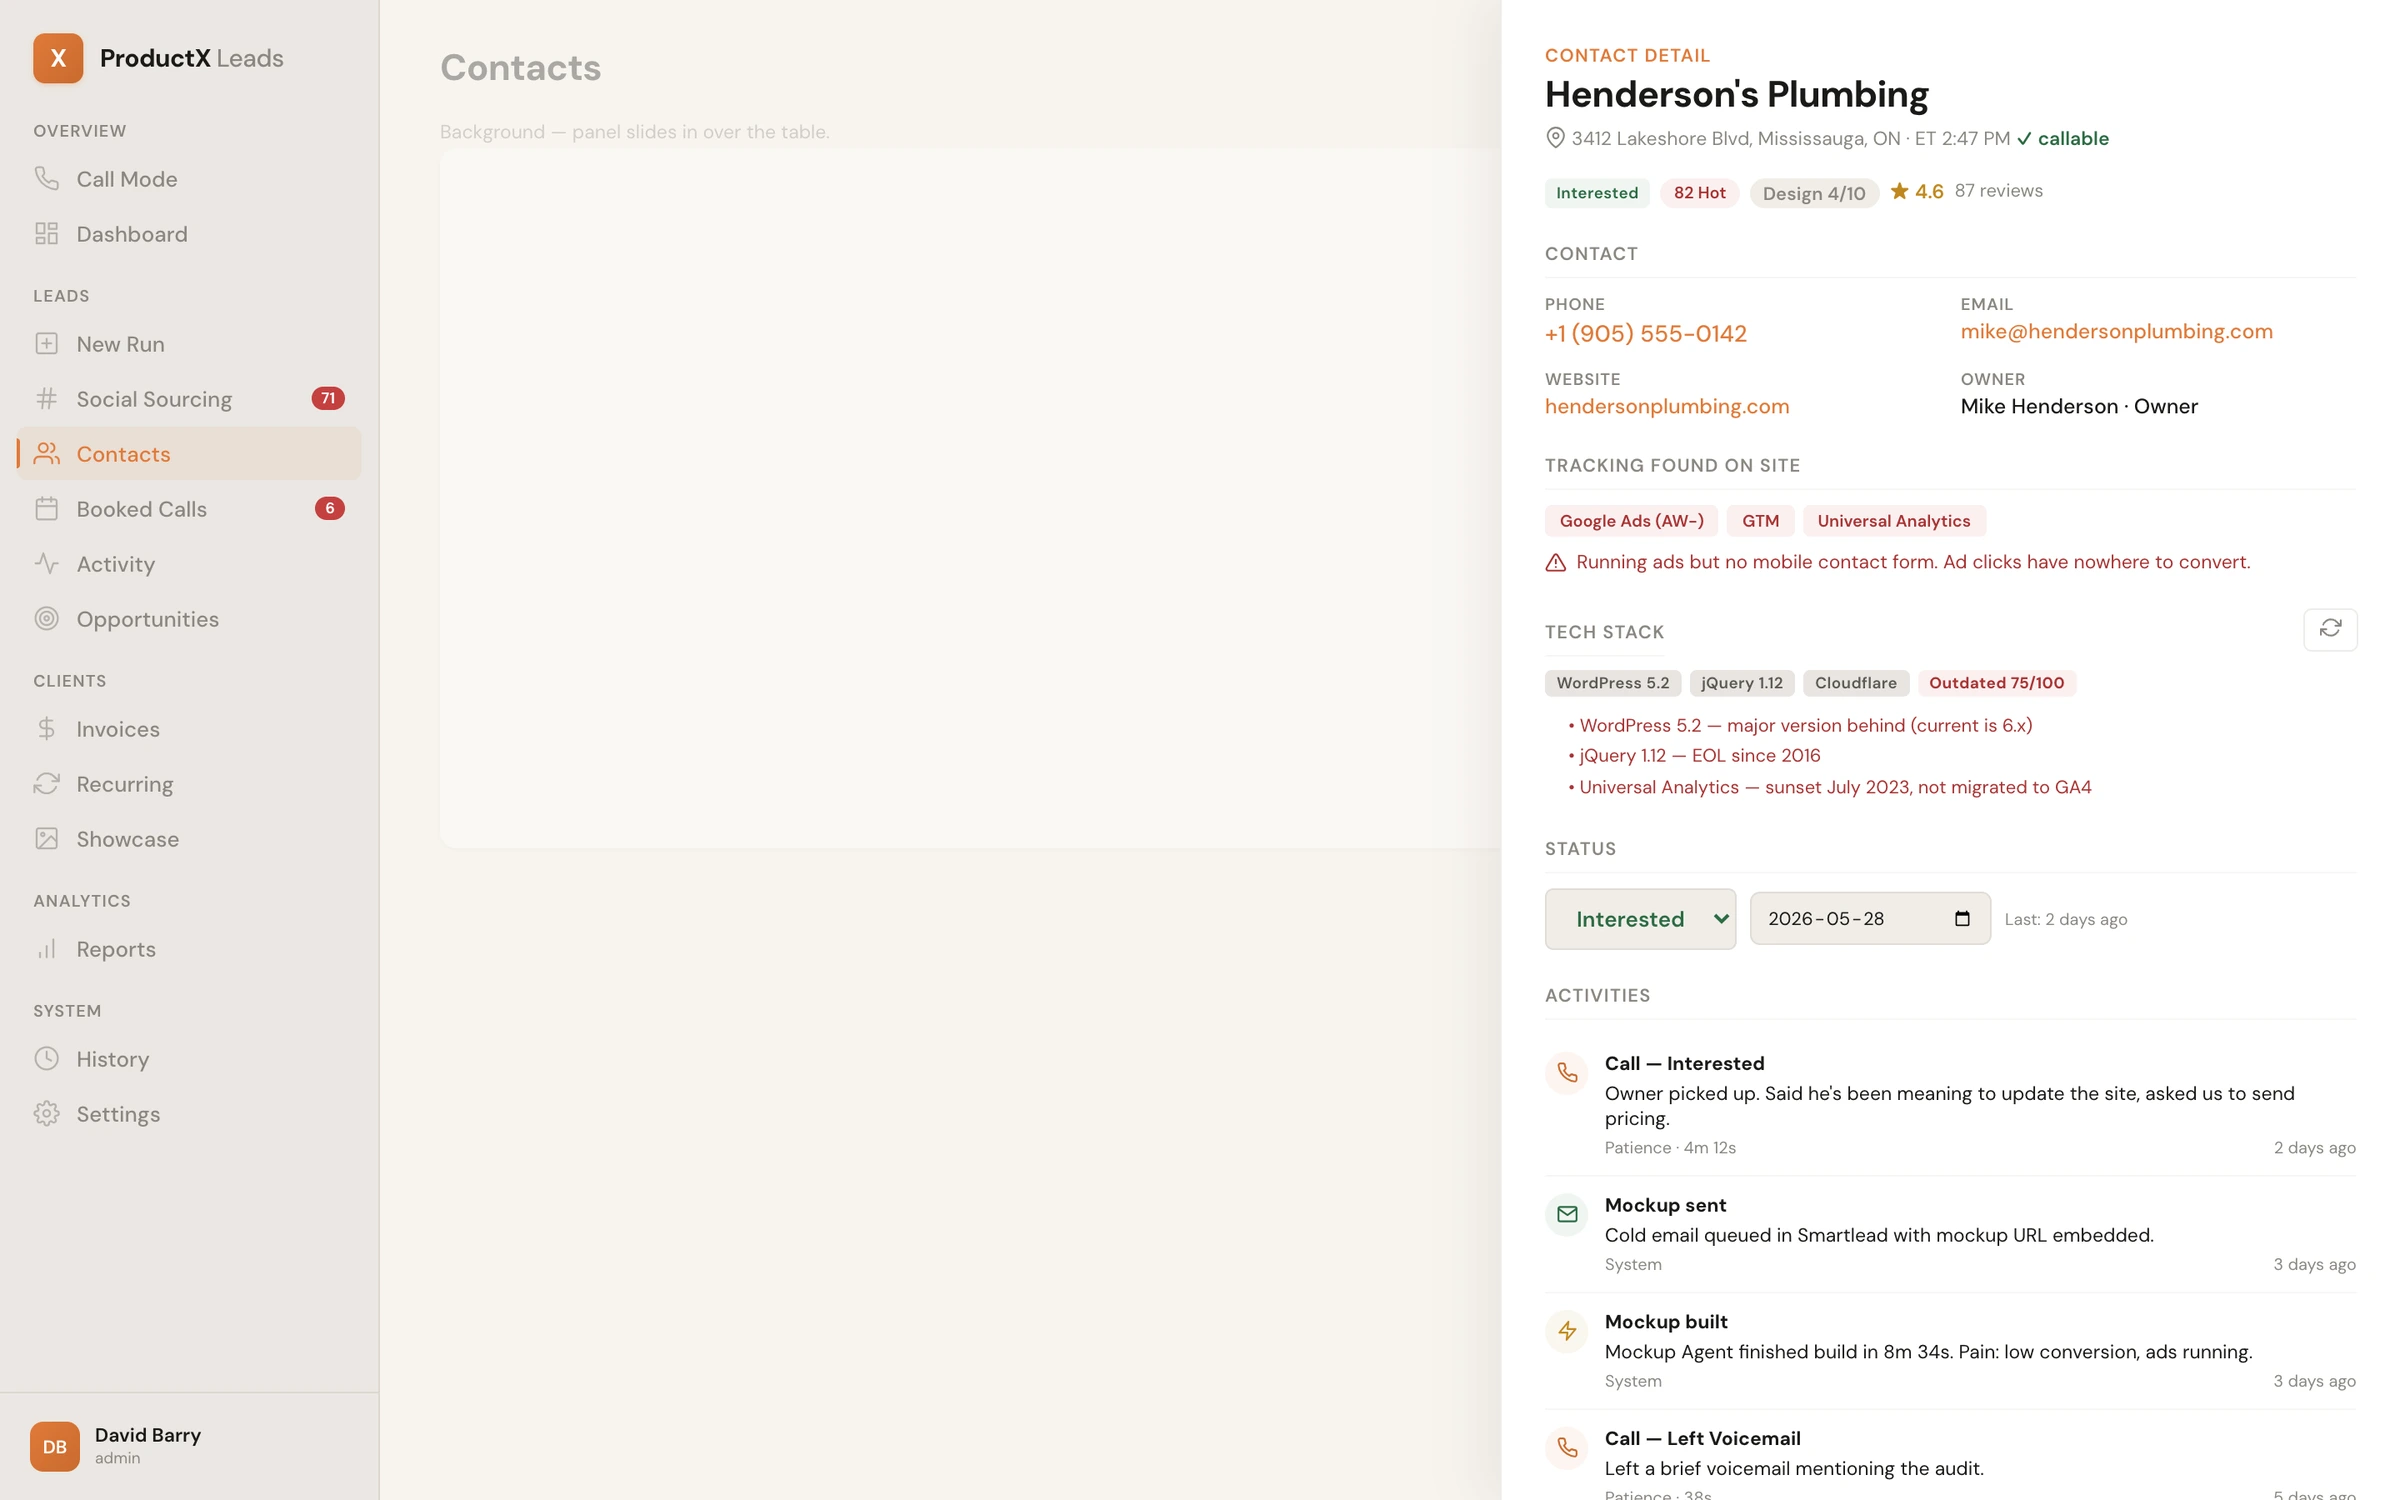
The signals are on the prospect's own website, not in a database.

Most B2B sales tools talk about intent in terms of which companies clicked around on third-party sites. I do not believe that data, and I cannot use it for small Ontario businesses anyway. So I built my own version. The system visits the prospect's homepage and a few sub pages and looks for things any honest person would call signals. Are they running Google Ads but missing a contact form on mobile, so all those clicks are landing nowhere? Is their site running an outdated WordPress that has not been touched in three years? Is the PageSpeed under 30? Each one of those is a real reason to call, and I put them in a column down the right side of the contact panel so the person on the phone can read them out.

Contact panel showing real signals from the prospect's website
Contact panel, with the actual reason to call

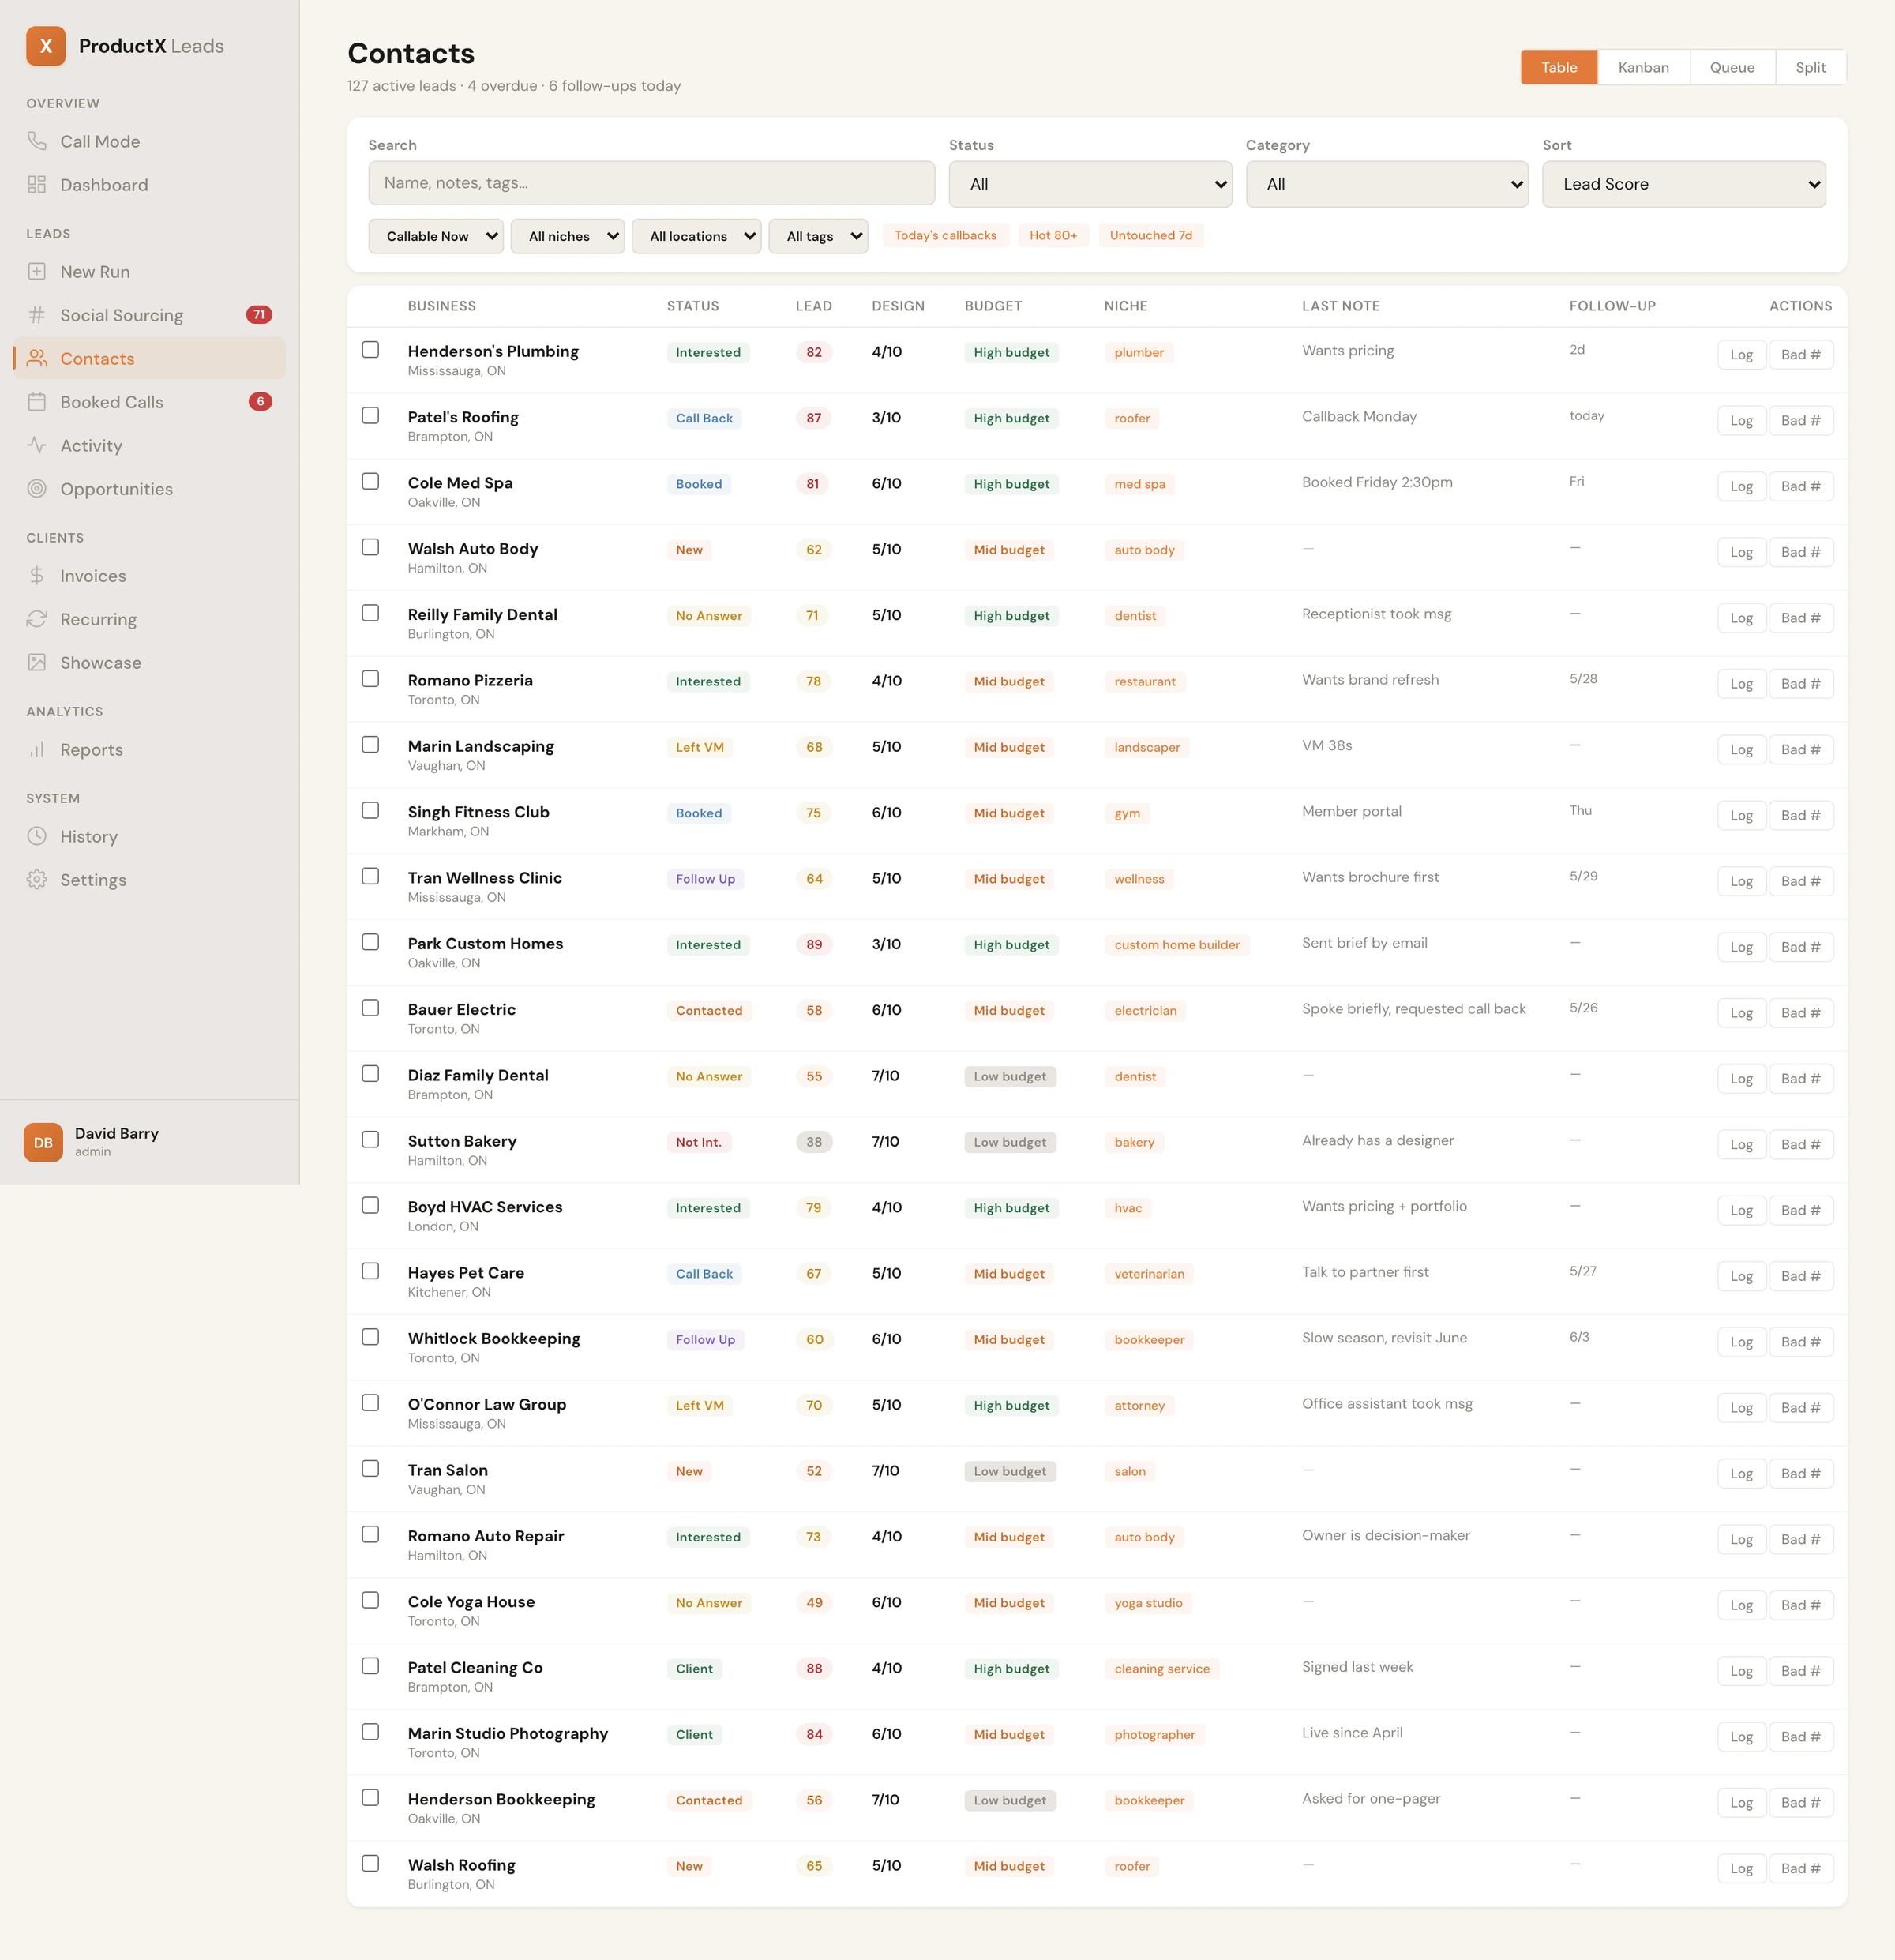
I designed it to be denser than UX advice would say.

Most UX writing about B2B tools tells you to use lots of whitespace and one action per screen. I went the other way because my actual users are doing 90-minute dialing sessions and they need to see thirty contacts at once. The font is small, the rows are tight, and twelve columns fit on a 1440 wide screen with no horizontal scrolling. The status pills are colour coded so the eye can scan the table from across the room and tell what kind of day it has been. Lots of yellow means the calls are not connecting. Light on green means nobody is biting today.

High-density contacts table
Twelve columns, eleven point font, no apologies

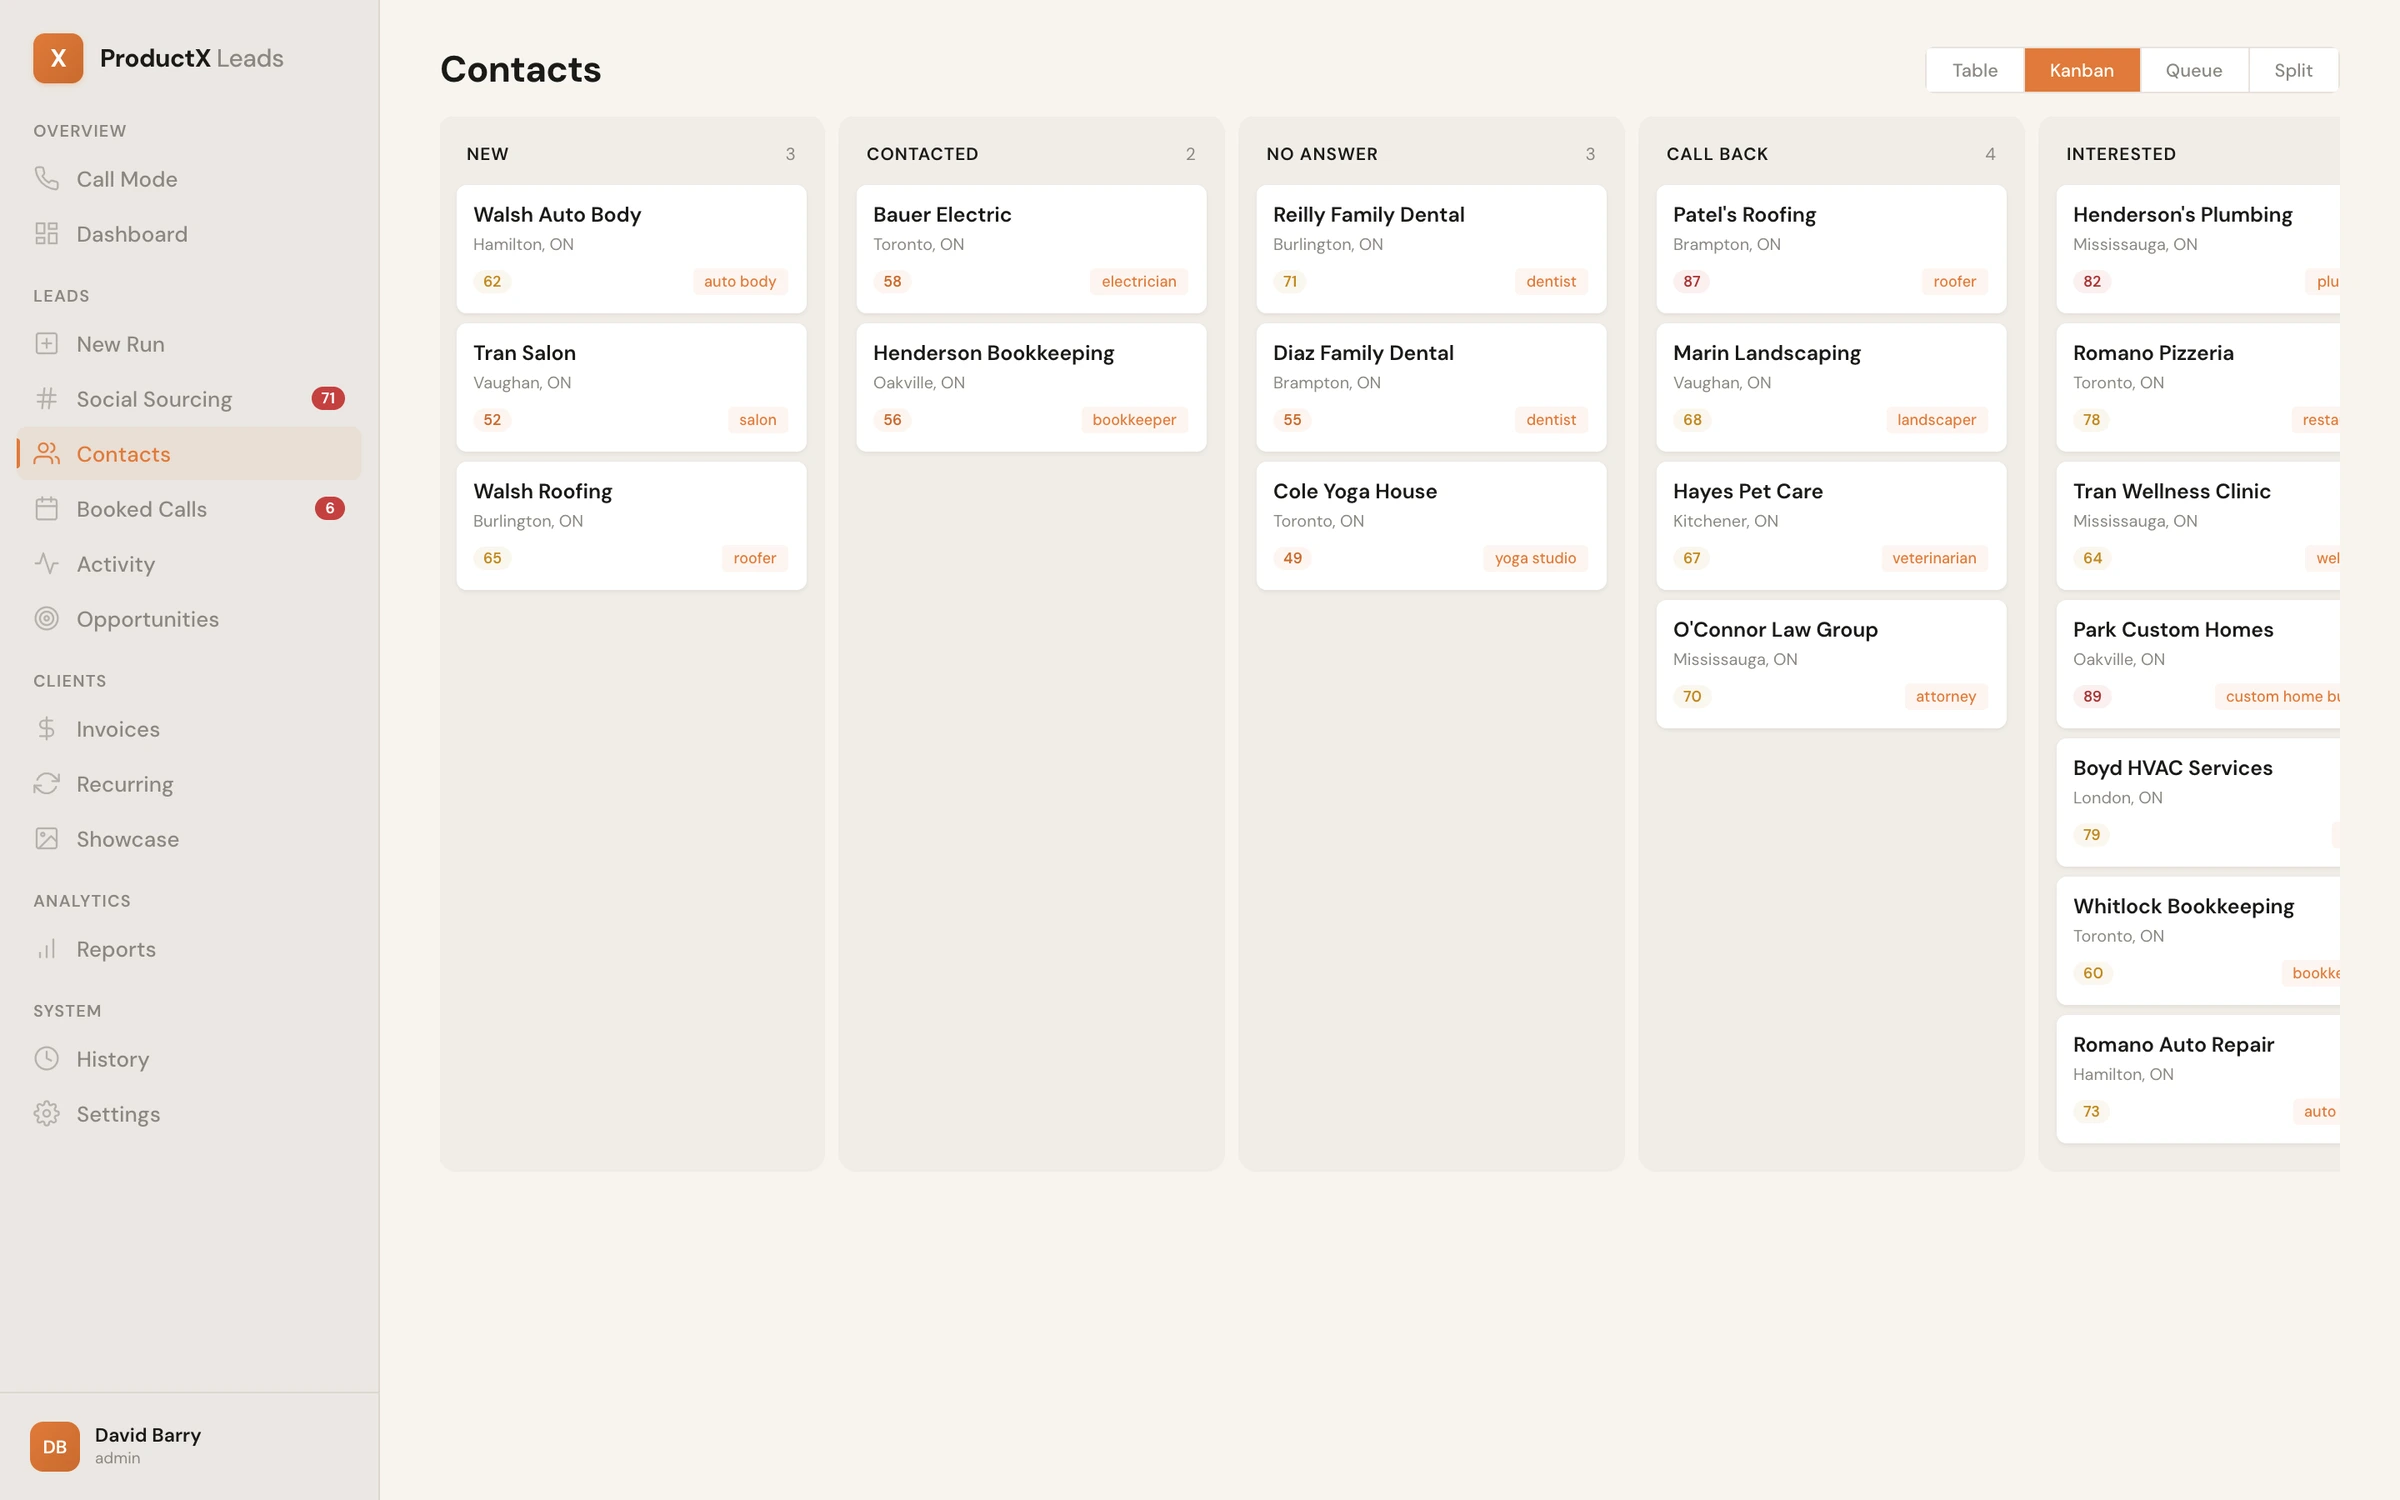
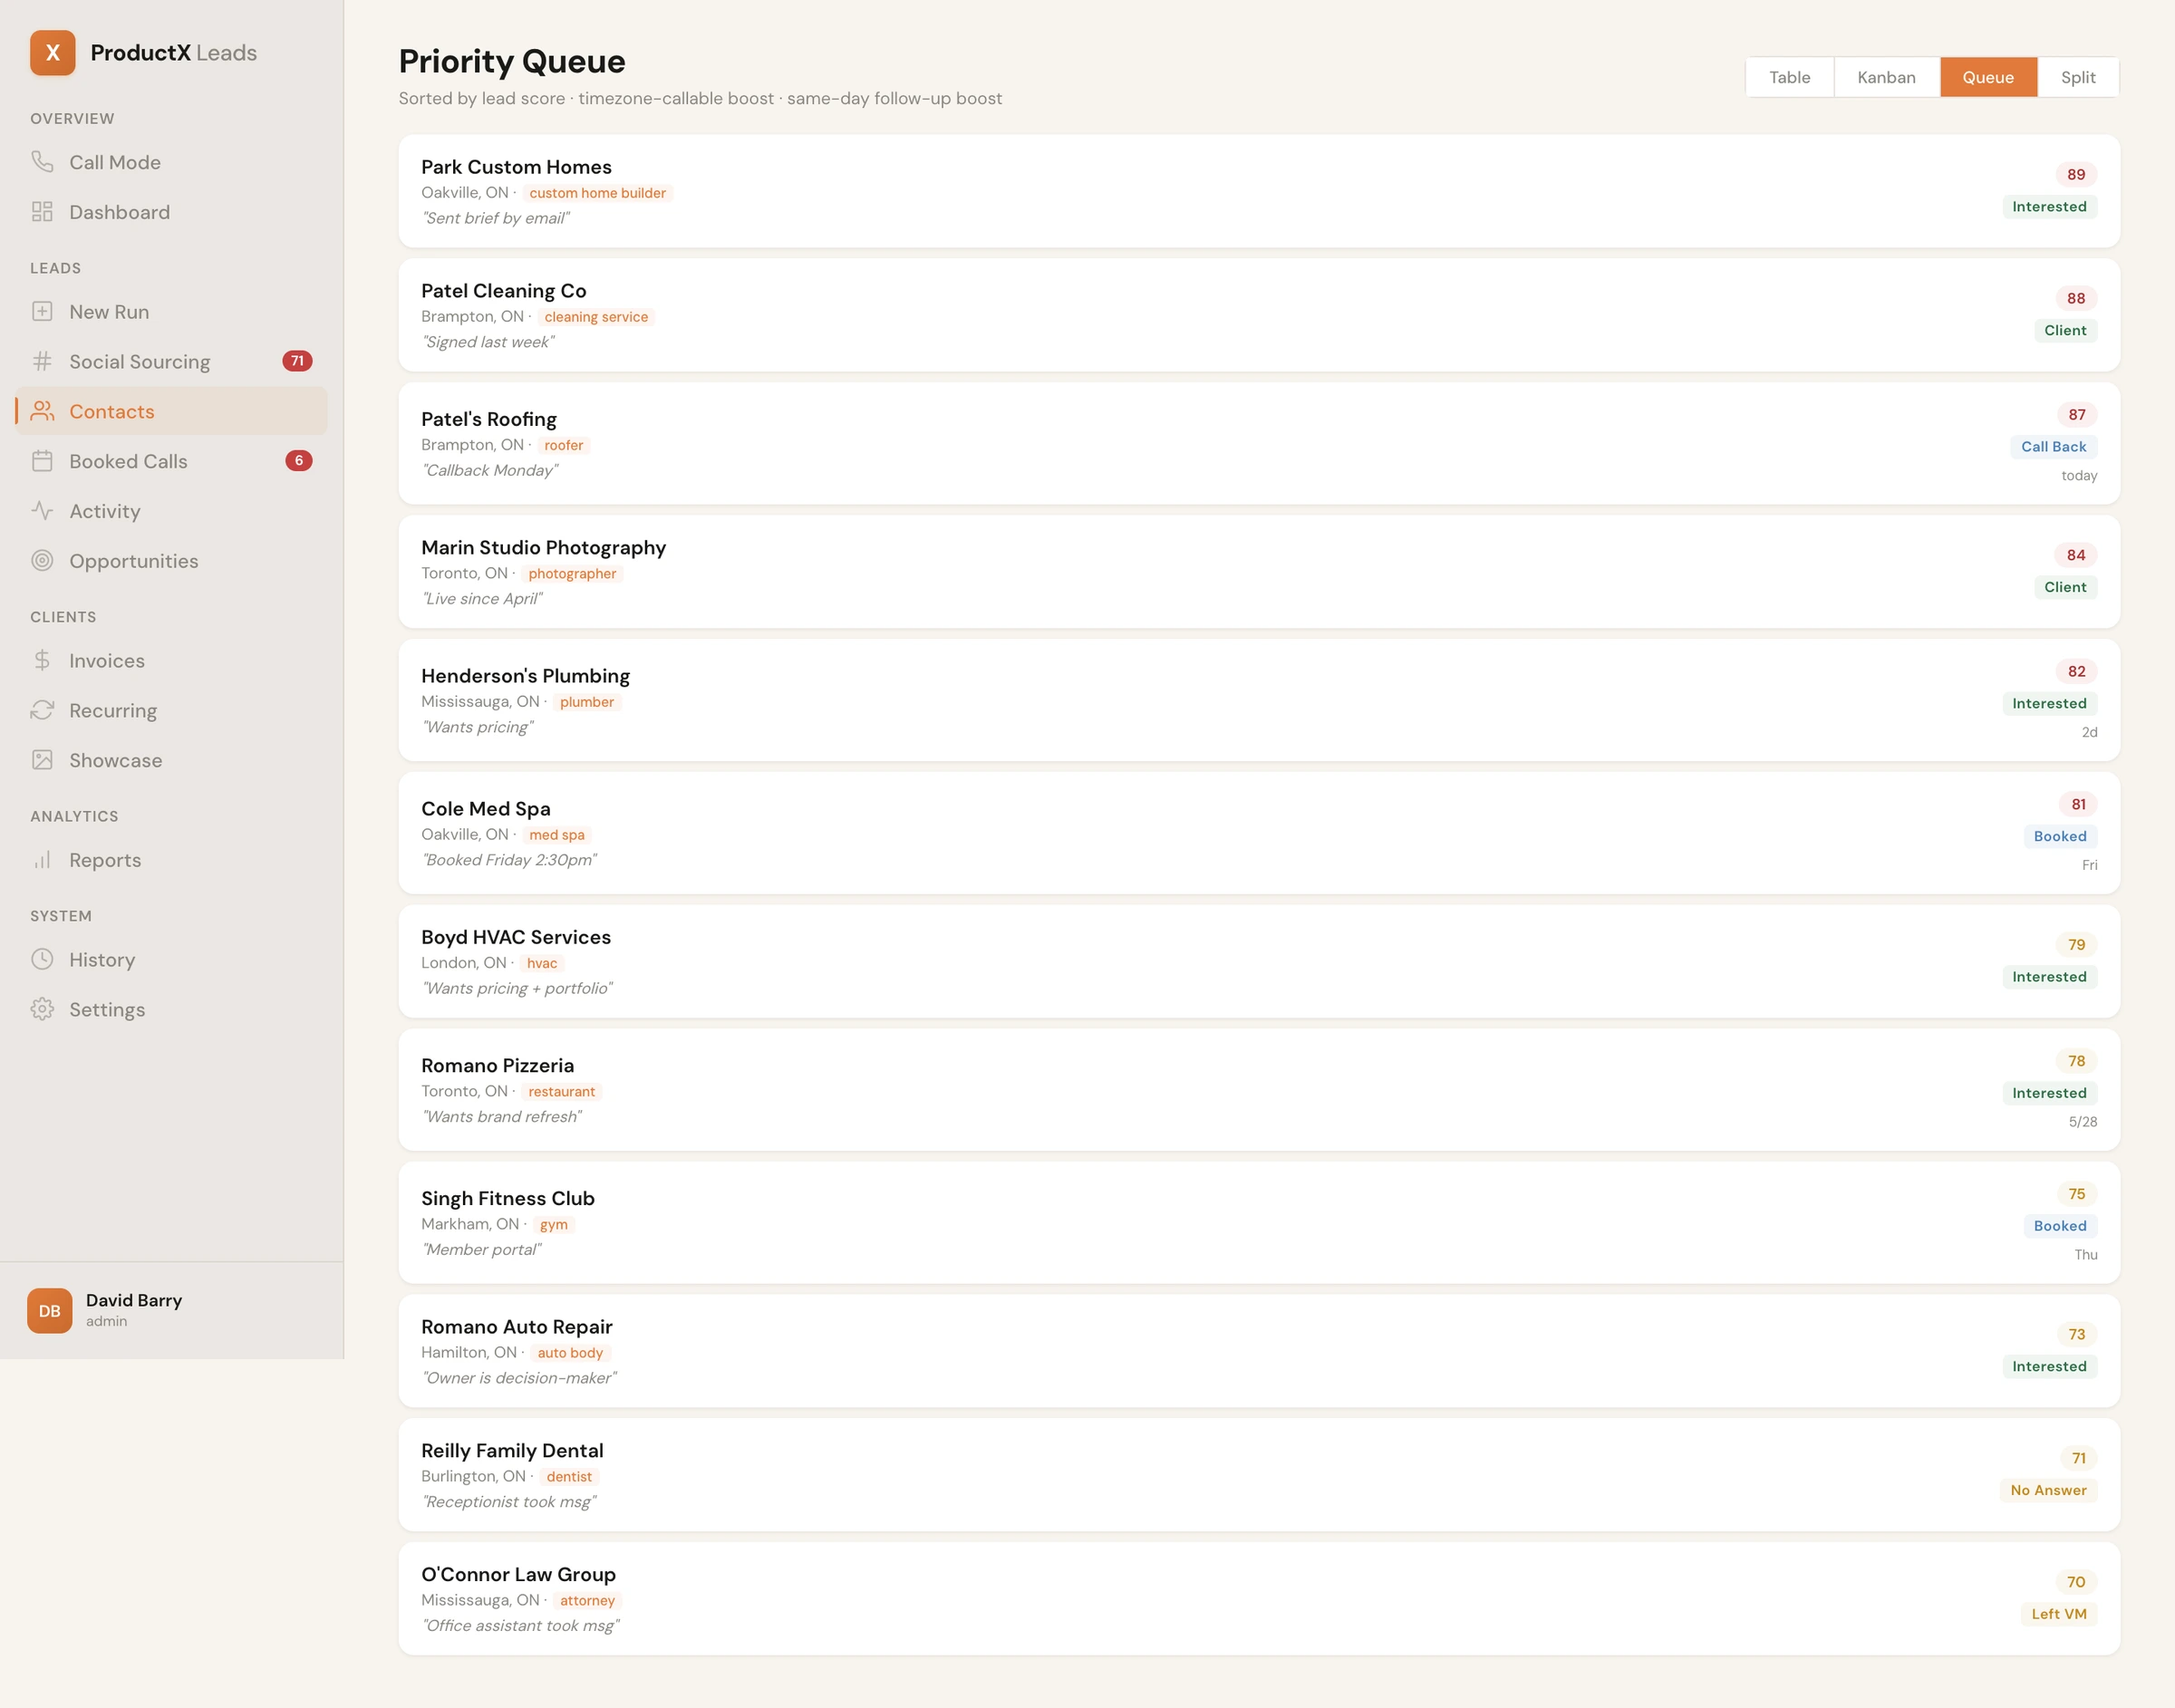
The same list, four ways to read it.

I built four ways to look at the same contacts because I noticed myself wanting different views at different times of day. Table is for scanning a lot at once. Kanban is for thinking about pipeline stage. Queue is for "just give me the next person I should call." Split is for working one contact while keeping the neighbours visible. Switching modes is faster than rearranging the UI inside one mode.

Contacts Kanban view
Kanban, by pipeline stage
Contacts Queue view
Queue, sorted by lead score and timezone

Five buttons. No menus. Next contact.

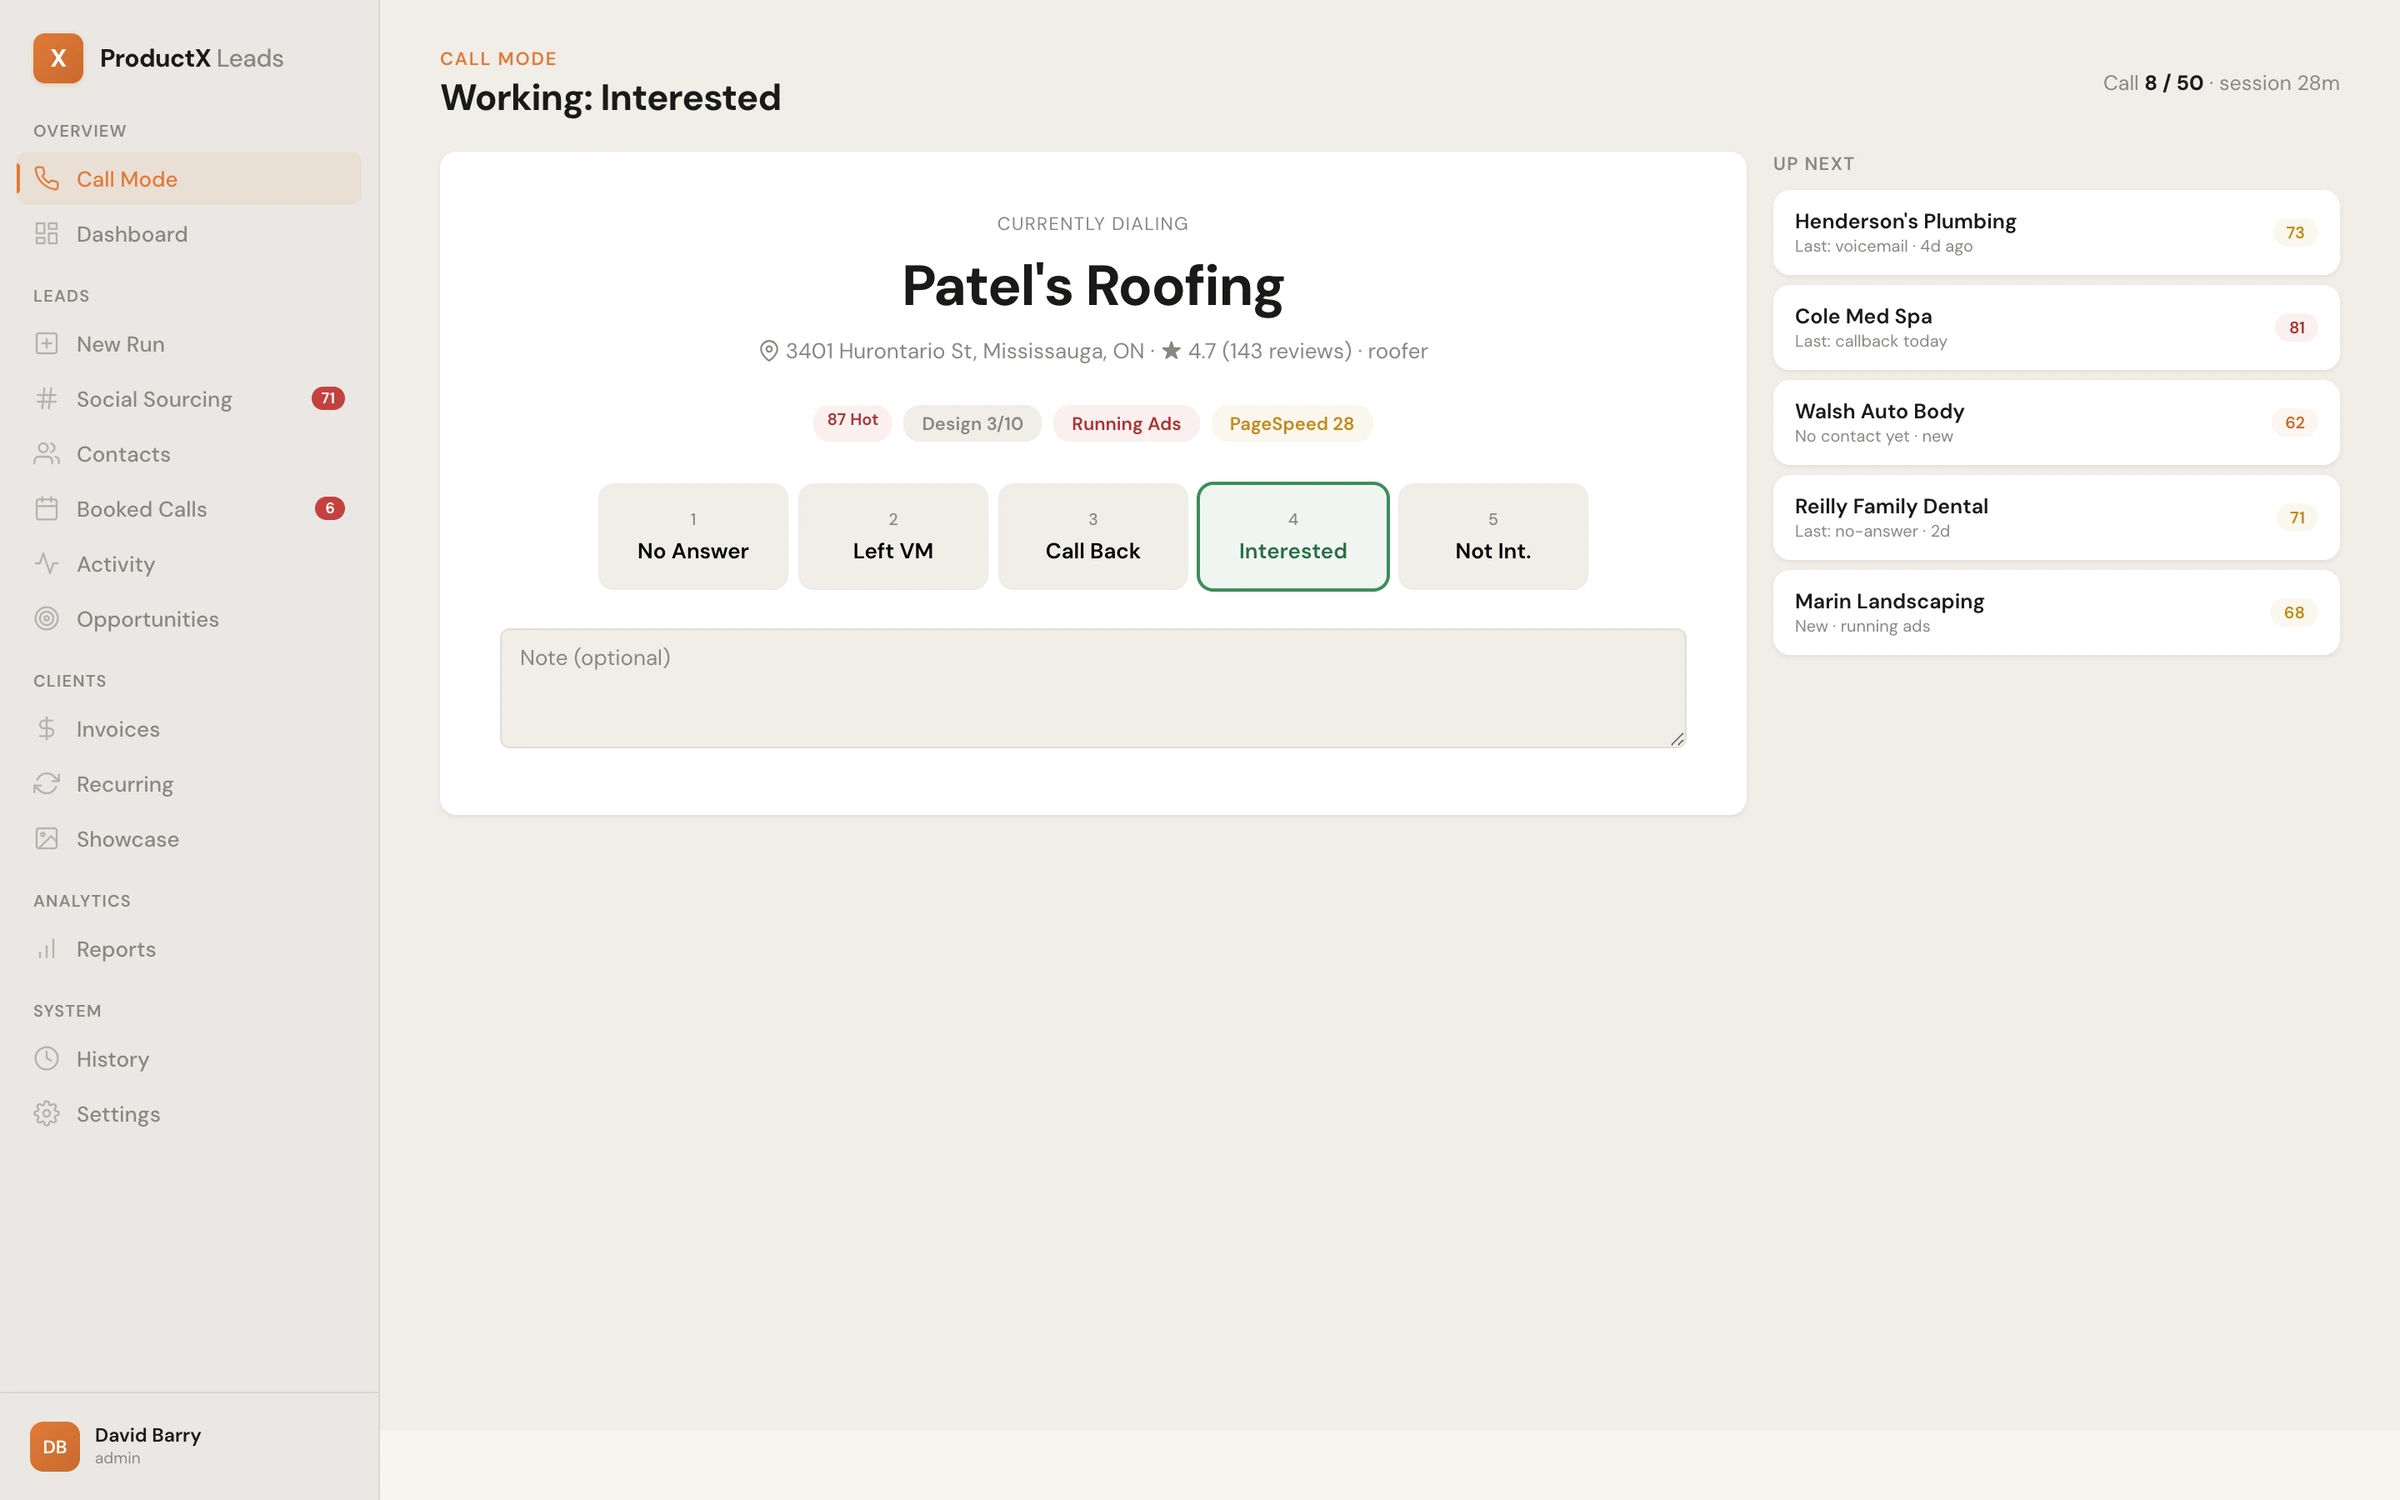
This is the dialing surface. I designed it for the part of the day where the setter is on the phone for a couple hours straight. There are five outcome buttons across the bottom and that is the whole interaction. You pick one, the contact is updated, and the next person shows up. The signals from that contact's website are stamped at the top so the person on the phone has the line ready. The Up Next column on the right shows the five contacts after this one so they can read ahead if there is a quick voicemail.

The boring win I am most proud of on this screen is the cooldown. If someone called this person in the last two hours, they are hidden from the queue. If a different setter has the contact open right now, they are also hidden. Tiny rules, but they prevent the most common embarrassing moment in a small sales team, which is two people calling the same lead five minutes apart.

ProductX Call Mode
Call mode, currently dialing
ProductX Booked Calls with show-rate breakdowns
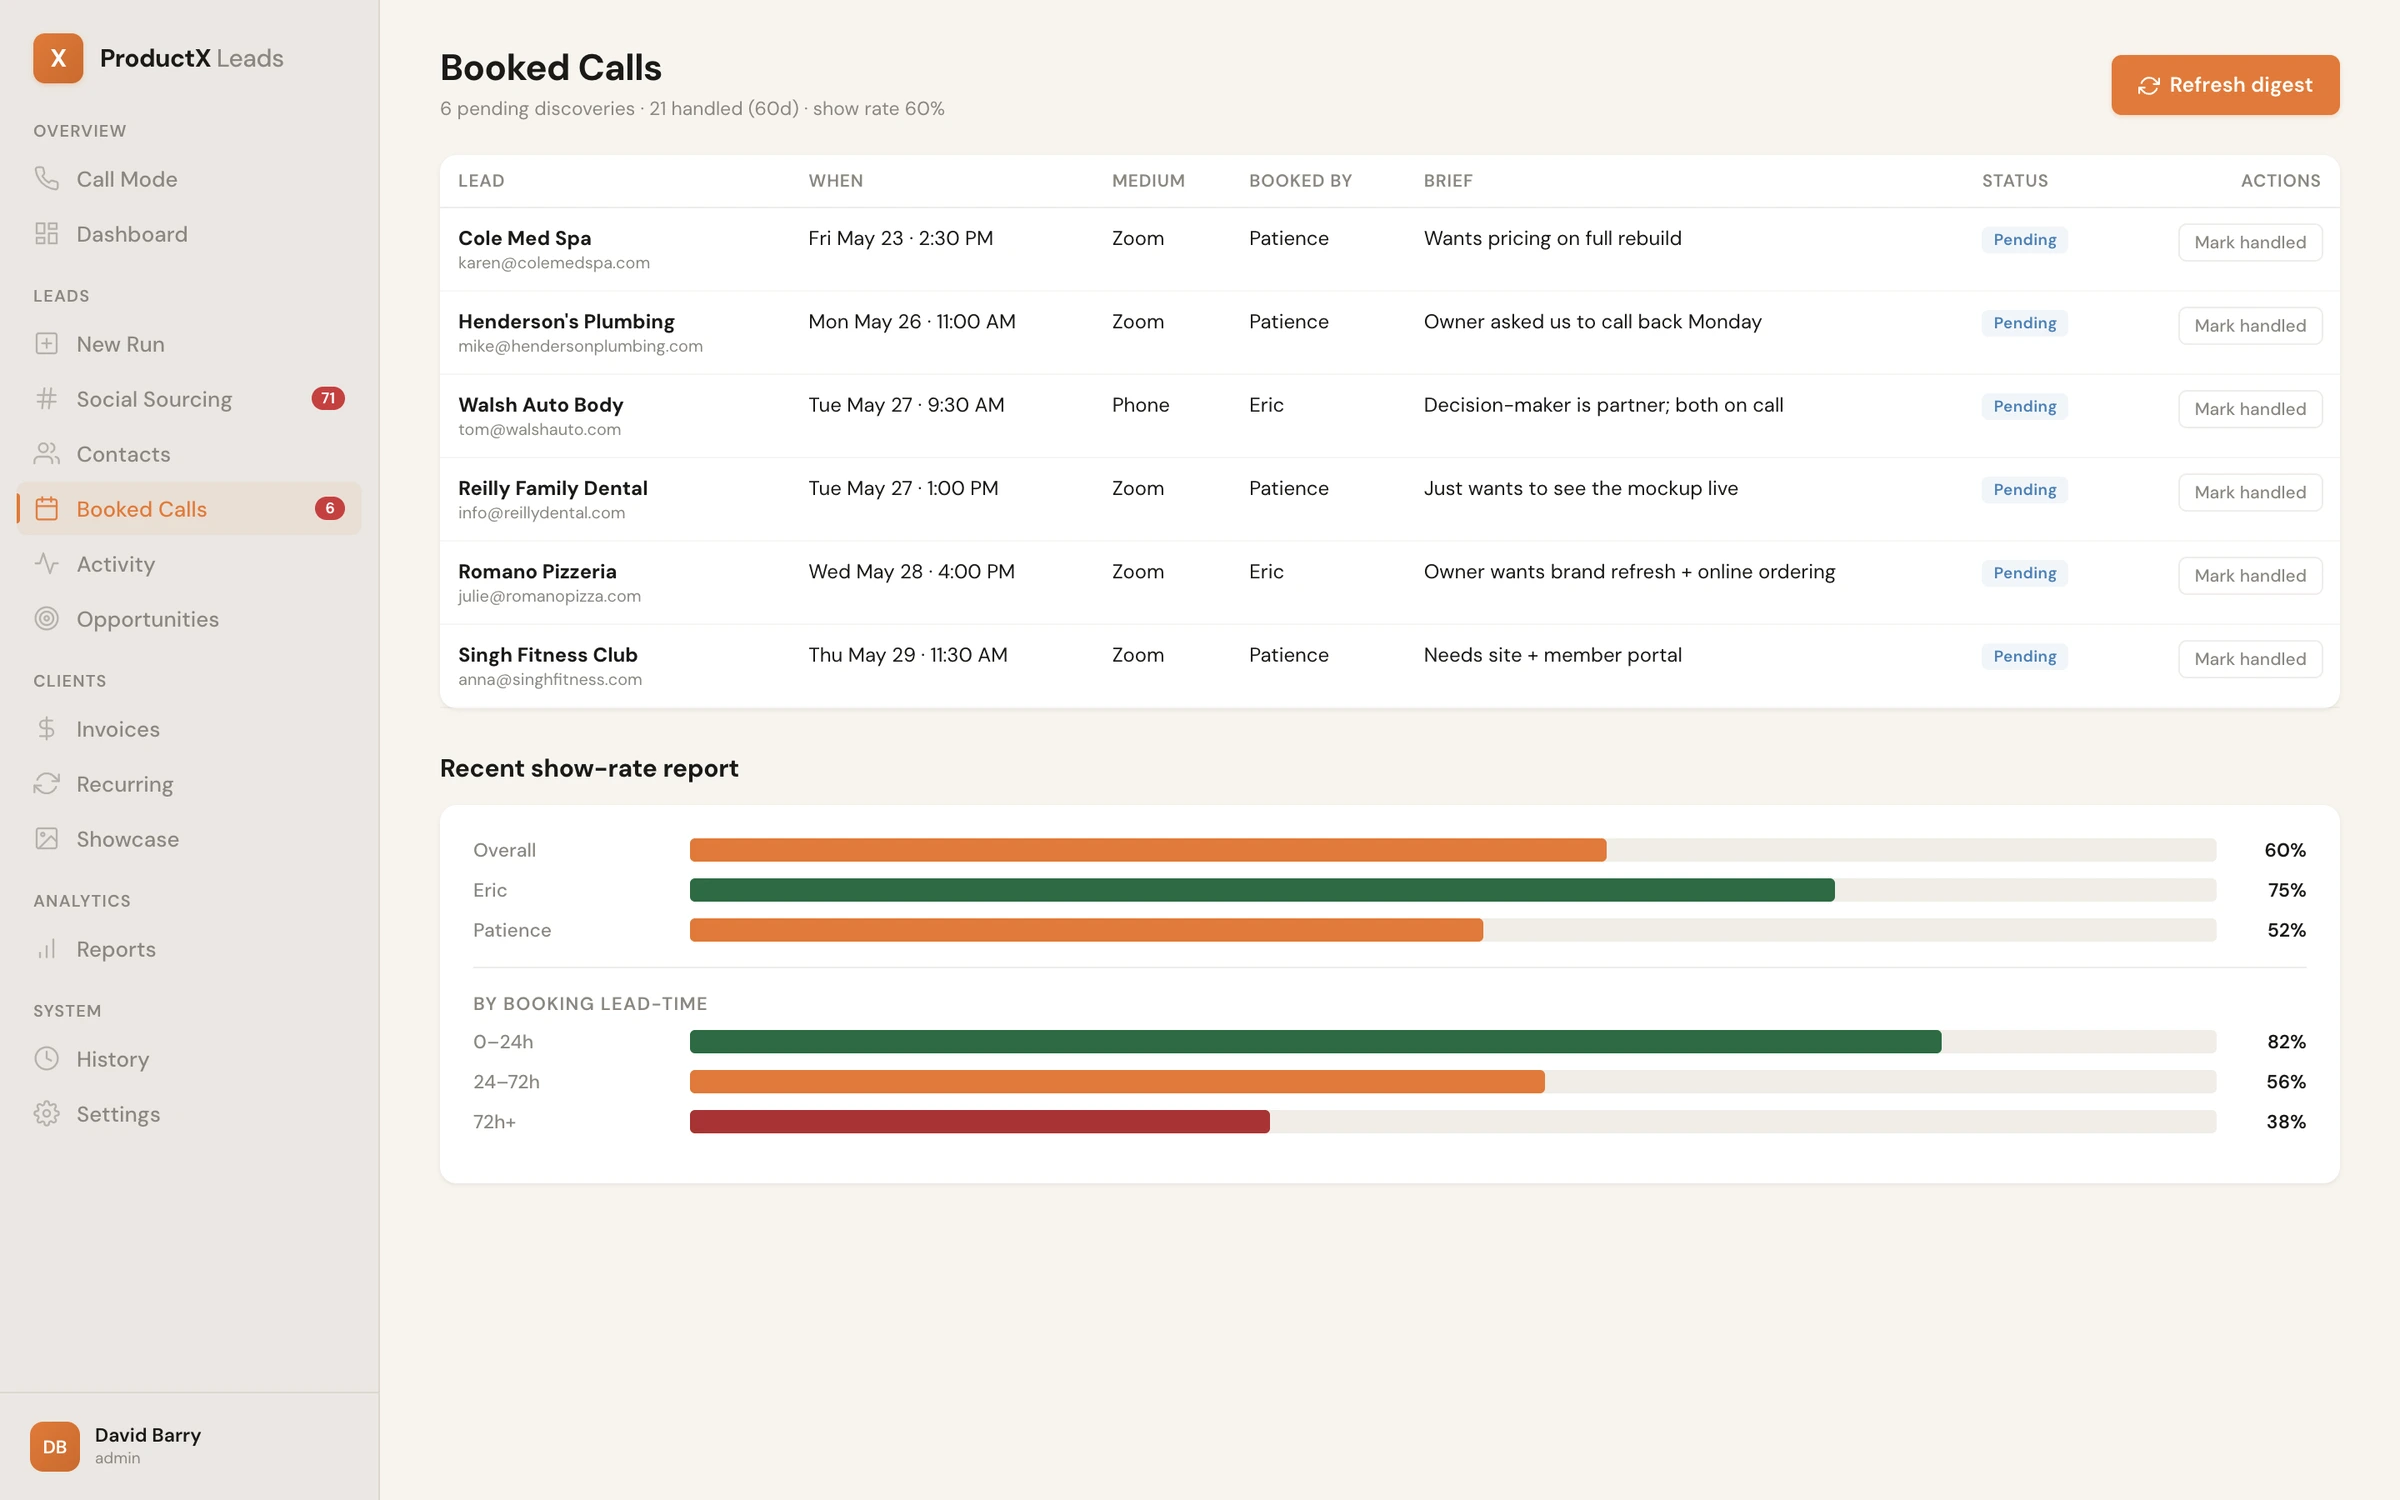
Booked calls, with show rate analytics

I built this screen because of an honest problem.

After running this for a few weeks I noticed something that I did not want to admit. The setters were marking contacts as "interested" at a much higher rate than the number of people who actually showed up to the booked call. There was a gap between the optimism on the phone and the reality of who answered the calendar invite. So I built this screen to make the gap visible.

The breakdown by setter is not for punishment, it is for coaching. One person is at 75 percent show rate, another is at 52 percent, and that tells me they are framing the booking differently on the call. The breakdown by lead time is the bigger story. Calls booked for today show up at 82 percent. Calls booked more than three days out drop to 38 percent. That number changed how we book. Now we book on the call, we book for this week, and we fire the calendar invite within a minute of hanging up. The cadence is the only reason the show rate is not worse.

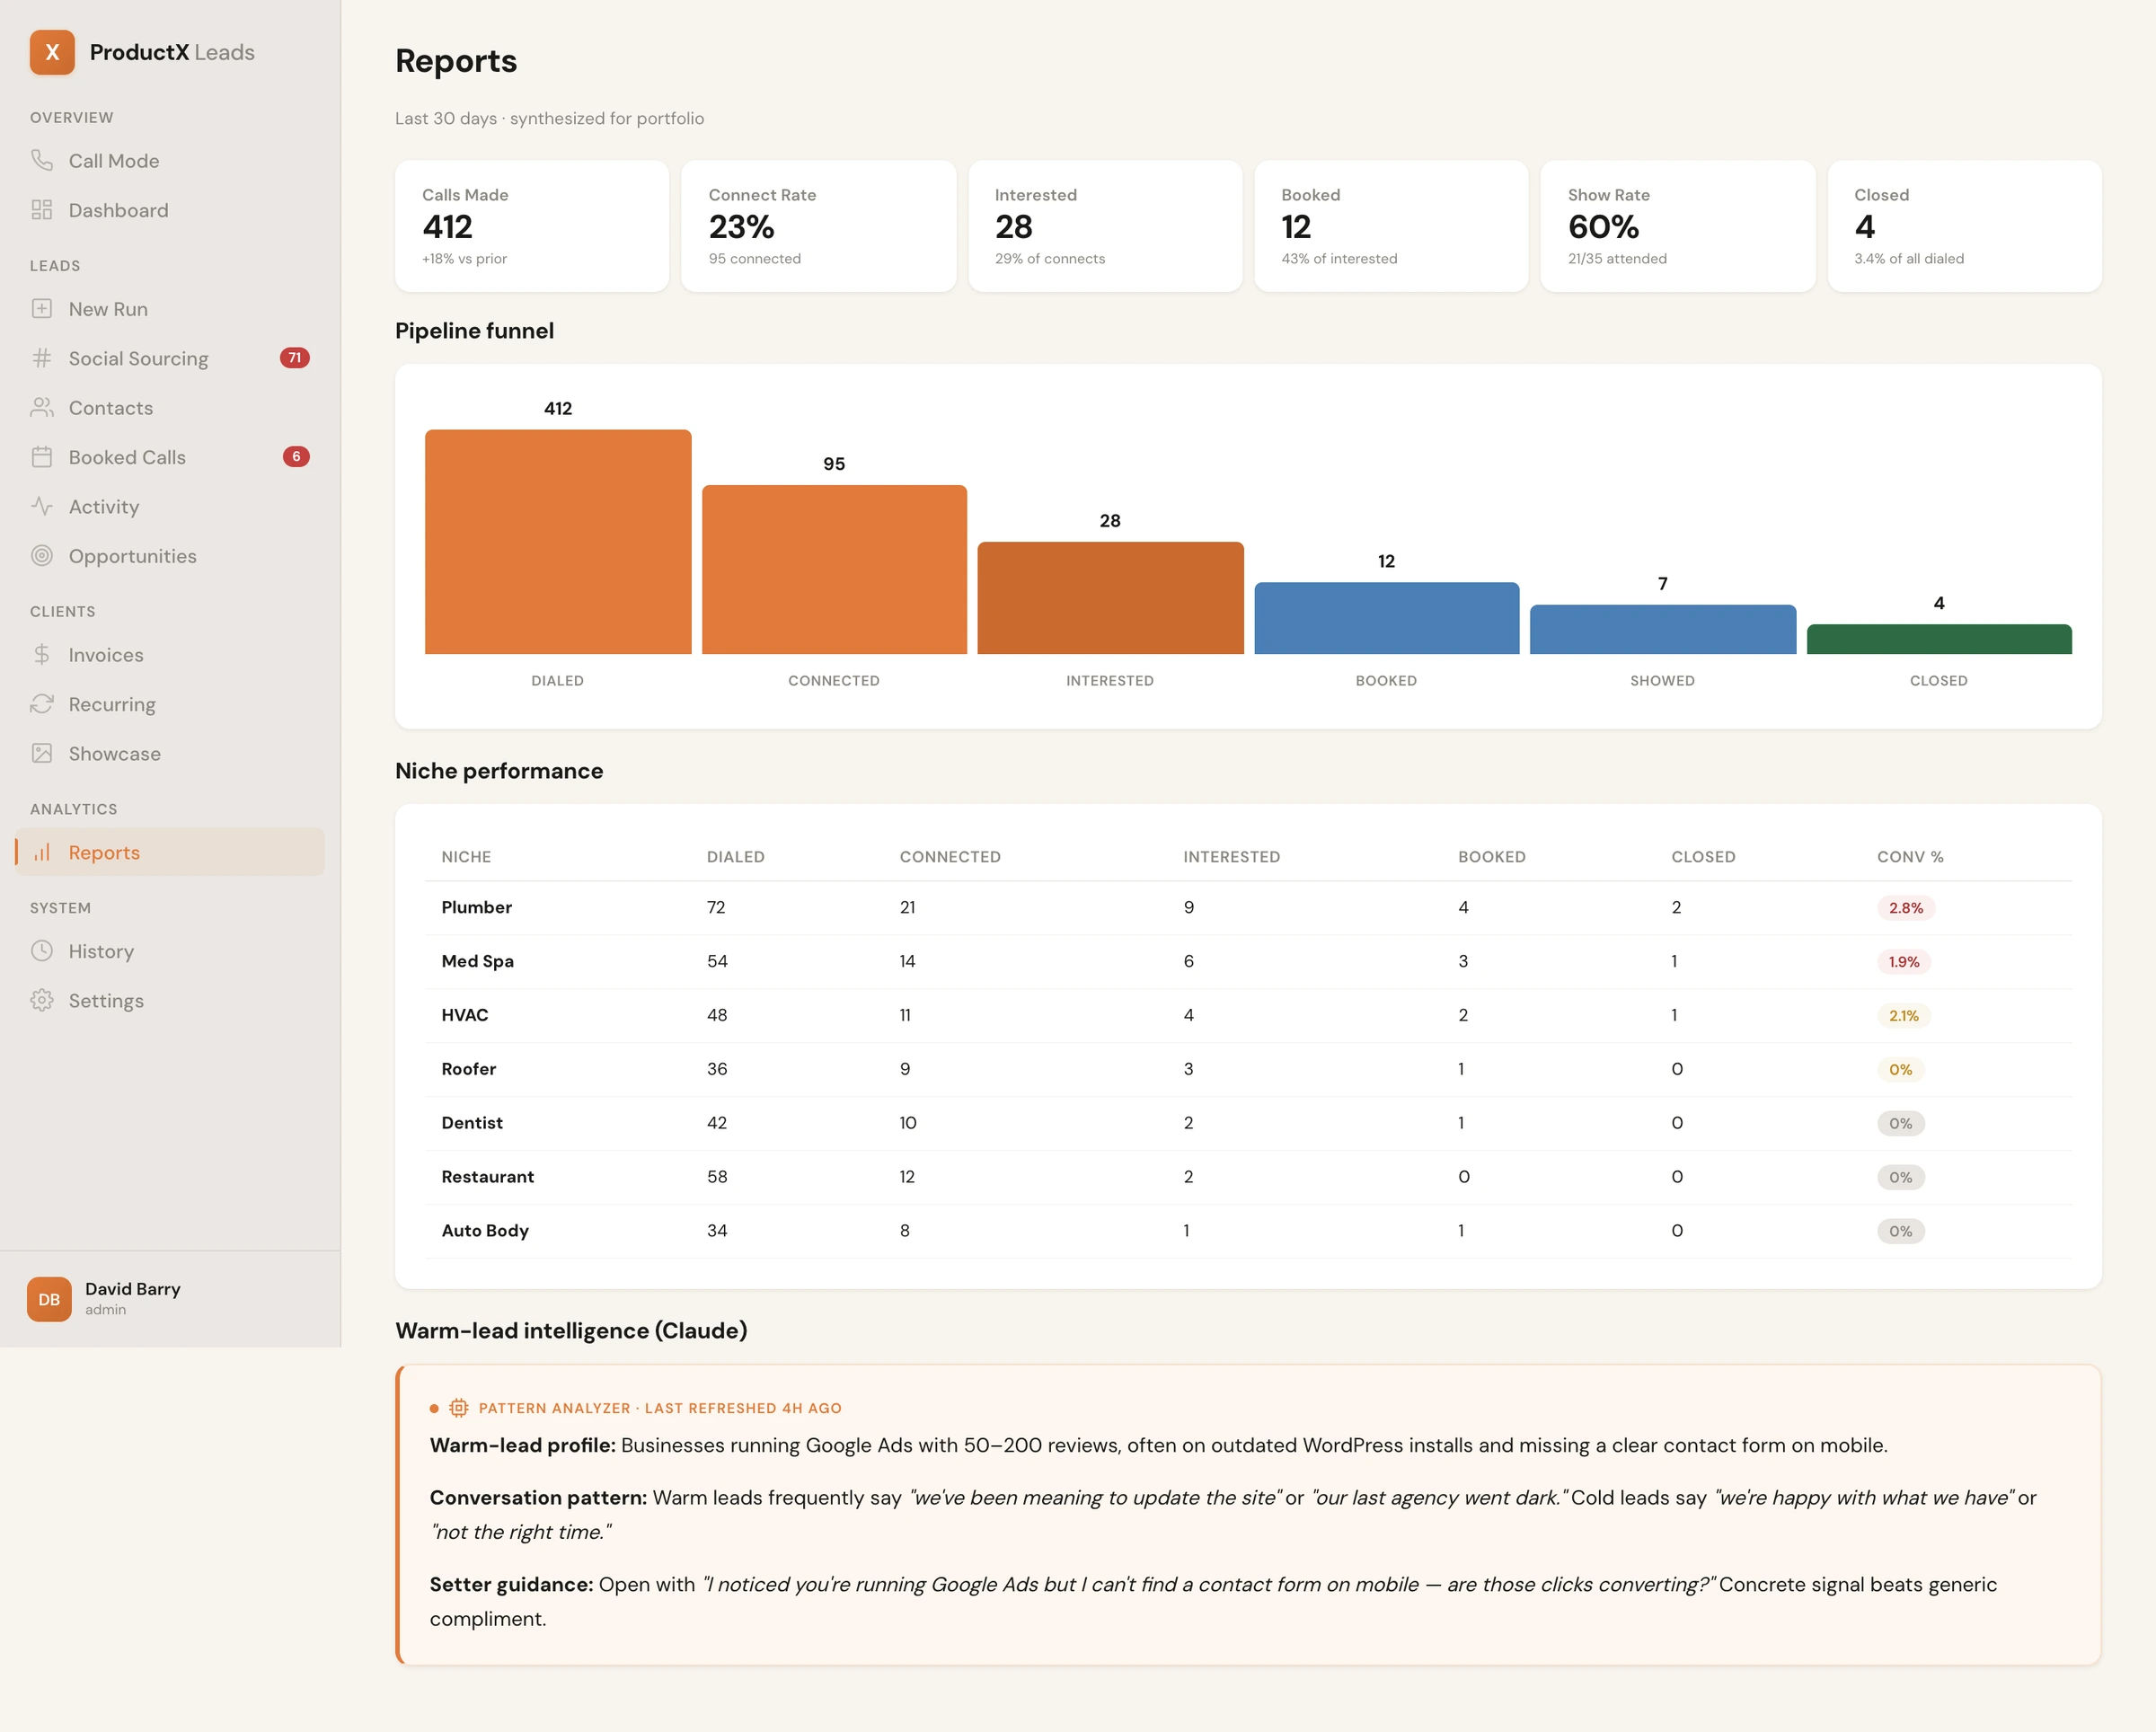
The funnel, by niche, with a paragraph from Claude.

I designed this screen for the end of the month. The funnel at the top is the only chart I needed, because that is the shape of the business. The niche table below it shows where the conversion rate is unusually high or low, which is what tells me whether a niche is worth doubling down on. The warm-lead intelligence paragraph at the bottom is written by Claude based on the actual contact notes from the last 30 days. I gave it one rule: do not generalize. It has to mention specific features of the leads, like outdated WordPress installs or missing mobile contact forms, not generic things like "the warm leads seem engaged."

ProductX Reports view
End of month, with the Claude paragraph at the bottom

Two modes for two parts of the day.

I designed the light mode for the morning review and admin work, when I am drinking coffee and looking at numbers. Dark mode is for the 90-minute dialing session, when the brightness of a white screen feels exhausting and the setter is staring at the same place for a while. The colour system underneath is the same in both modes. Only the background and the text colours change. The status pills, the lead score chips, the niche tags all hold the same hierarchy in both.

ProductX dashboard in light mode
Light, daytime work
ProductX dashboard in dark mode
Dark, dialing sessions

Decisions I would defend if you asked.

These are the ones I argued myself out of the obvious choice on.

01

I built it as an internal tool, not a SaaS product.

The temptation was to build this as something I could sell. I argued myself out of it. A SaaS product needs onboarding flows, marketing pages, tenant separation, billing, and a support team. An internal tool needs none of those. By the time I had reached feature parity with the tools I was avoiding, I would have spent two years on it. As an internal tool I shipped the first version in a couple of weeks and have iterated from there.

02

Density over whitespace.

Most B2B UX writing tells you to use a lot of whitespace and one action per screen. I went the other way because my users are doing 90-minute dialing sessions and they need to see thirty contacts at once. The table runs at eleven point font and that is intentional. The setters thanked me for it. The version with bigger whitespace would have been pretty and useless.

03

The cost is always visible.

Anywhere AI is doing work, I made the cost visible. The new run wizard shows the estimated cost before you press Start. The model toggle is honest about which one is cheaper. The cached audits flag tells you when something is free. I did this because the inverse, hidden AI cost, is the most exhausting pattern I have run into using other tools.

04

I built it with Claude Code, and I am not embarrassed to say so.

I am a designer. I do not write production code from scratch. I describe what I want a screen to do, I describe the data model I want underneath, I describe the behaviour I want when something fails, and Claude writes the code. I am the one making the decisions and reviewing what comes out. This is a real thing I do now, and the case study should say so plainly. The reason this product exists in the form it does is because I can think about the design and the build at the same time, and the AI handles the parts that would otherwise have eaten my year.

05

I do not use SMS for anything important.

The obvious thing to do for a call reminder is send an SMS. I tried that and removed it the same day. Business owners read email on a laptop and barely notice SMS notifications. The thing that actually works is a real calendar invite at the moment of booking, an email reminder two hours before, and a Discord ping to the closer fifteen minutes out. Anything else is noise.

06

No self-serve booking from cold email.

Lots of advice says cold emails should end with a "book a call" link. I tested it and the show rate from self-serve booking is dramatically worse than from a verbal yes on a phone call. So we do not offer it. The setter books on the call, the calendar invite goes out within a minute, and the show rate is much higher. The friction is the feature.

The path is more useful than the destination here.

Three real branches that did not make it into the version I use today.

×

The full rebuild in a fancier framework.

I started a rewrite in a more "proper" stack with a real database and a typed component library. I got about a third of the way in and stopped because none of it was making the tool better. It was making it more complicated to maintain. The simple version I shipped first is still the version I use, and it loads faster than the rewrite ever would have.

×

SMS reminders to leads before the call.

Built it and pulled it the same day. People do not read SMS reminders from numbers they do not recognize. The calendar invite is the durable artifact. Anything on top of that is noise we are sending to ourselves to feel like we are doing something.

×

Cheap monthly pricing on the design service.

The original positioning for the design business was $99 a month with no setup fee. I changed it to a setup fee plus a smaller monthly with a six-month minimum after the data showed that anchor-free monthly pricing attracts the worst clients. The new pricing is reflected everywhere in the tool. Cold email templates, claim page copy, the closer's pitch. The pricing change is a design decision because it changed what the product talks about.

1.6K Leads
currently in flight
1 Designer
using Claude Code as the builder

The tool I wish I could buy.

Every part of this product exists because no SaaS option fit the shape of the work I actually do. I designed every screen for myself and the two people on the phones with me. I built it with Claude Code because that is the only way a designer like me could ship a tool this complete on this timeline. None of it is for sale. All of it is in daily use.